GoldmanSachs GSEU full analysis,charts,indicators,moving averages,SMA,DMA,EMA,ADX,MACD,RSIGoldman Sachs GSEU WideScreen charts, DMA,SMA,EMA technical analysis, forecast prediction, by indicators ADX,MACD,RSI,CCI AMEX stock exchange
Daily price and charts and targets GoldmanSachs Strong Daily Stock price targets for GoldmanSachs GSEU are 44.19 and 44.28 | Daily Target 1 | 44.11 | | Daily Target 2 | 44.17 | | Daily Target 3 | 44.2 | | Daily Target 4 | 44.26 | | Daily Target 5 | 44.29 |
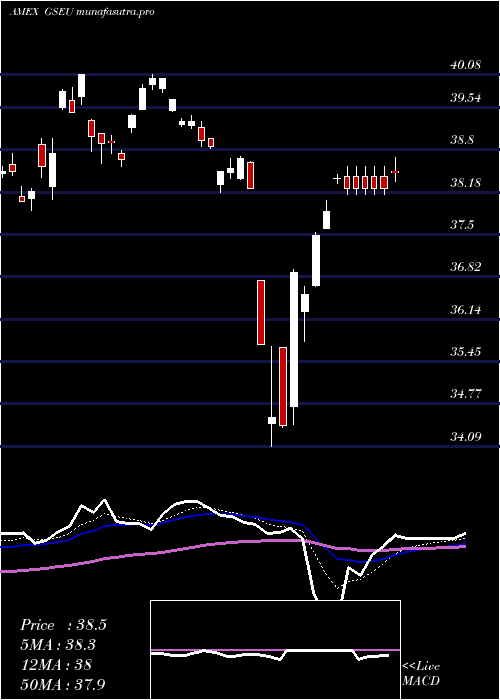
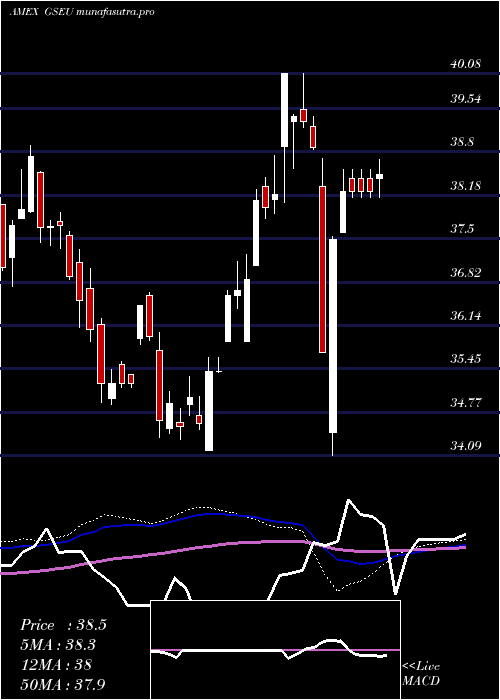
Daily price and volume Goldman Sachs
| Date |
Closing |
Open |
Range |
Volume |
Fri 24 October 2025 |
44.23 (0.32%) |
44.15 |
44.14 - 44.23 |
0.2699 times |
Thu 23 October 2025 |
44.09 (0.71%) |
44.03 |
44.03 - 44.09 |
0.2876 times |
Wed 22 October 2025 |
43.78 (-0.16%) |
43.98 |
43.73 - 44.01 |
0.6089 times |
Tue 21 October 2025 |
43.85 (-0.57%) |
43.96 |
43.83 - 43.99 |
0.5769 times |
Mon 20 October 2025 |
44.10 (0.27%) |
43.97 |
43.92 - 44.10 |
1.3942 times |
Fri 17 October 2025 |
43.98 (-0.02%) |
43.75 |
43.73 - 43.99 |
1.6353 times |
Thu 16 October 2025 |
43.99 (0.62%) |
43.93 |
43.84 - 44.13 |
2.3056 times |
Wed 15 October 2025 |
43.72 (0.07%) |
43.72 |
43.53 - 43.80 |
0.8347 times |
Tue 14 October 2025 |
43.69 (0.58%) |
43.29 |
43.26 - 43.75 |
0.982 times |
Mon 13 October 2025 |
43.44 (0.65%) |
43.20 |
43.17 - 43.48 |
1.1048 times |
Fri 10 October 2025 |
43.16 (-1.05%) |
43.69 |
43.13 - 43.78 |
1.1539 times |
Weekly price and charts GoldmanSachs Strong weekly Stock price targets for GoldmanSachs GSEU are 43.98 and 44.48 | Weekly Target 1 | 43.56 | | Weekly Target 2 | 43.9 | | Weekly Target 3 | 44.063333333333 | | Weekly Target 4 | 44.4 | | Weekly Target 5 | 44.56 |
Weekly price and volumes for Goldman Sachs
| Date |
Closing |
Open |
Range |
Volume |
Fri 24 October 2025 |
44.23 (0.57%) |
43.97 |
43.73 - 44.23 |
0.7963 times |
Fri 17 October 2025 |
43.98 (1.9%) |
43.20 |
43.17 - 44.13 |
1.7417 times |
Fri 10 October 2025 |
43.16 (-2.64%) |
44.19 |
43.13 - 44.26 |
1.0449 times |
Fri 03 October 2025 |
44.33 (2.73%) |
43.23 |
43.20 - 44.41 |
1.2141 times |
Fri 26 September 2025 |
43.15 (-0.19%) |
43.18 |
42.53 - 43.57 |
1.0873 times |
Fri 19 September 2025 |
43.23 (-0.12%) |
43.48 |
43.18 - 43.55 |
1.4238 times |
Fri 12 September 2025 |
43.28 (1.03%) |
43.06 |
42.89 - 43.40 |
0.8038 times |
Fri 05 September 2025 |
42.84 (0.05%) |
42.15 |
41.98 - 42.98 |
1.0842 times |
Fri 29 August 2025 |
42.82 (0%) |
42.82 |
42.75 - 42.83 |
0.0997 times |
Fri 29 August 2025 |
42.82 (-2.33%) |
43.67 |
42.75 - 43.74 |
0.7041 times |
Fri 22 August 2025 |
43.84 (1.13%) |
43.15 |
43.12 - 43.91 |
1.7883 times |
Monthly price and charts GoldmanSachs Strong monthly Stock price targets for GoldmanSachs GSEU are 43.68 and 44.96 | Monthly Target 1 | 42.64 | | Monthly Target 2 | 43.44 | | Monthly Target 3 | 43.923333333333 | | Monthly Target 4 | 44.72 | | Monthly Target 5 | 45.2 |
Monthly price and volumes Goldman Sachs
| Date |
Closing |
Open |
Range |
Volume |
Fri 24 October 2025 |
44.23 (1.31%) |
43.82 |
43.13 - 44.41 |
0.4241 times |
Tue 30 September 2025 |
43.66 (1.96%) |
42.15 |
41.98 - 43.66 |
0.4709 times |
Fri 29 August 2025 |
42.82 (3.5%) |
41.08 |
40.90 - 43.91 |
0.4339 times |
Thu 31 July 2025 |
41.37 (-2.27%) |
42.11 |
41.37 - 43.41 |
0.6207 times |
Mon 30 June 2025 |
42.33 (-0.09%) |
42.33 |
41.31 - 43.41 |
1.5889 times |
Fri 30 May 2025 |
42.37 (4.93%) |
40.30 |
40.09 - 42.79 |
1.3184 times |
Wed 30 April 2025 |
40.38 (4.83%) |
38.50 |
34.09 - 41.44 |
2.1476 times |
Mon 31 March 2025 |
38.52 (0.86%) |
38.95 |
38.06 - 40.08 |
0.9255 times |
Fri 28 February 2025 |
38.19 (4.12%) |
35.88 |
35.88 - 38.81 |
0.587 times |
Fri 31 January 2025 |
36.68 (5.83%) |
34.61 |
34.17 - 37.14 |
1.483 times |
Tue 31 December 2024 |
34.66 (-1.62%) |
35.93 |
34.37 - 36.66 |
1.3622 times |

DMA SMA EMA moving averages of Goldman Sachs GSEU
DMA (daily moving average) of Goldman Sachs GSEU
| DMA period | DMA value | | 5 day DMA | 44.01 | | 12 day DMA | 43.8 | | 20 day DMA | 43.86 | | 35 day DMA | 43.58 | | 50 day DMA | 43.41 | | 100 day DMA | 42.88 | | 150 day DMA | 41.83 | | 200 day DMA | 40.78 | EMA (exponential moving average) of Goldman Sachs GSEU
| EMA period | EMA current | EMA prev | EMA prev2 | | 5 day EMA | 44.04 | 43.94 | 43.86 | | 12 day EMA | 43.91 | 43.85 | 43.81 | | 20 day EMA | 43.8 | 43.76 | 43.72 | | 35 day EMA | 43.64 | 43.6 | 43.57 | | 50 day EMA | 43.43 | 43.4 | 43.37 |
SMA (simple moving average) of Goldman Sachs GSEU
| SMA period | SMA current | SMA prev | SMA prev2 | | 5 day SMA | 44.01 | 43.96 | 43.94 | | 12 day SMA | 43.8 | 43.79 | 43.77 | | 20 day SMA | 43.86 | 43.81 | 43.74 | | 35 day SMA | 43.58 | 43.54 | 43.51 | | 50 day SMA | 43.41 | 43.39 | 43.37 | | 100 day SMA | 42.88 | 42.86 | 42.85 | | 150 day SMA | 41.83 | 41.8 | 41.77 | | 200 day SMA | 40.78 | 40.73 | 40.69 |
|
|
