GoldmanSachs GSEE full analysis,charts,indicators,moving averages,SMA,DMA,EMA,ADX,MACD,RSIGoldman Sachs GSEE WideScreen charts, DMA,SMA,EMA technical analysis, forecast prediction, by indicators ADX,MACD,RSI,CCI AMEX stock exchange
Daily price and charts and targets GoldmanSachs Strong Daily Stock price targets for GoldmanSachs GSEE are 56.99 and 57.42 | Daily Target 1 | 56.68 | | Daily Target 2 | 56.86 | | Daily Target 3 | 57.113333333333 | | Daily Target 4 | 57.29 | | Daily Target 5 | 57.54 |
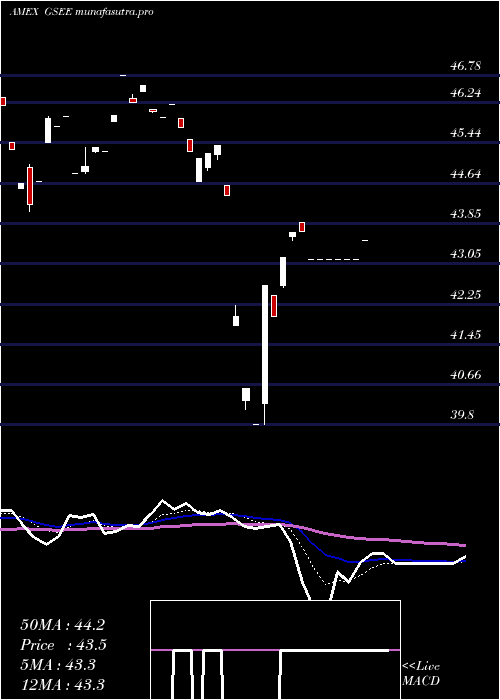
Daily price and volume Goldman Sachs
| Date |
Closing |
Open |
Range |
Volume |
Thu 23 October 2025 |
57.03 (0.81%) |
56.98 |
56.94 - 57.37 |
2.5349 times |
Wed 22 October 2025 |
56.57 (-0.48%) |
56.72 |
56.38 - 57.00 |
0.6314 times |
Tue 21 October 2025 |
56.84 (-0.63%) |
56.84 |
56.84 - 56.84 |
0.0374 times |
Mon 20 October 2025 |
57.20 (0.95%) |
56.85 |
56.85 - 57.20 |
0.7864 times |
Fri 17 October 2025 |
56.66 (-0.02%) |
56.41 |
56.41 - 56.94 |
0.4239 times |
Thu 16 October 2025 |
56.67 (0.59%) |
57.12 |
56.55 - 57.12 |
1.3916 times |
Wed 15 October 2025 |
56.34 (1.59%) |
56.56 |
56.34 - 56.56 |
0.3745 times |
Tue 14 October 2025 |
55.46 (-0.82%) |
55.27 |
55.17 - 55.92 |
1.5729 times |
Mon 13 October 2025 |
55.92 (2.91%) |
55.63 |
55.63 - 56.09 |
1.7227 times |
Fri 10 October 2025 |
54.34 (-3.5%) |
54.55 |
54.34 - 54.55 |
0.5243 times |
Thu 09 October 2025 |
56.31 (-0.9%) |
56.40 |
56.12 - 56.40 |
0.1123 times |
Weekly price and charts GoldmanSachs Strong weekly Stock price targets for GoldmanSachs GSEE are 56.71 and 57.7 | Weekly Target 1 | 55.94 | | Weekly Target 2 | 56.48 | | Weekly Target 3 | 56.926666666667 | | Weekly Target 4 | 57.47 | | Weekly Target 5 | 57.92 |
Weekly price and volumes for Goldman Sachs
| Date |
Closing |
Open |
Range |
Volume |
Thu 23 October 2025 |
57.03 (0.65%) |
56.85 |
56.38 - 57.37 |
0.5116 times |
Fri 17 October 2025 |
56.66 (4.27%) |
55.63 |
55.17 - 57.12 |
0.7033 times |
Fri 10 October 2025 |
54.34 (-3.98%) |
56.61 |
54.34 - 56.97 |
0.2836 times |
Fri 03 October 2025 |
56.59 (2.87%) |
55.66 |
55.43 - 56.89 |
3.8541 times |
Fri 26 September 2025 |
55.01 (-0.76%) |
55.28 |
54.88 - 55.70 |
3.2072 times |
Fri 19 September 2025 |
55.43 (1.43%) |
55.04 |
54.83 - 55.92 |
0.1056 times |
Fri 12 September 2025 |
54.65 (3.41%) |
53.41 |
53.13 - 54.88 |
0.1488 times |
Fri 05 September 2025 |
52.85 (0.99%) |
52.23 |
52.23 - 52.97 |
0.1056 times |
Fri 29 August 2025 |
52.33 (0%) |
52.26 |
52.26 - 52.33 |
0.024 times |
Fri 29 August 2025 |
52.33 (-1.38%) |
52.82 |
51.98 - 52.82 |
1.0563 times |
Fri 22 August 2025 |
53.06 (1.41%) |
52.64 |
52.06 - 53.09 |
0.024 times |

Monthly price and charts GoldmanSachs Strong monthly Stock price targets for GoldmanSachs GSEE are 55.69 and 58.72 | Monthly Target 1 | 53.22 | | Monthly Target 2 | 55.12 | | Monthly Target 3 | 56.246666666667 | | Monthly Target 4 | 58.15 | | Monthly Target 5 | 59.28 |
Monthly price and volumes Goldman Sachs
| Date |
Closing |
Open |
Range |
Volume |
Thu 23 October 2025 |
57.03 (2.68%) |
55.90 |
54.34 - 57.37 |
0.6362 times |
Tue 30 September 2025 |
55.54 (6.13%) |
52.23 |
52.23 - 55.93 |
2.8014 times |
Fri 29 August 2025 |
52.33 (3.09%) |
50.43 |
50.43 - 53.09 |
0.5014 times |
Thu 31 July 2025 |
50.76 (0.55%) |
50.52 |
50.14 - 52.26 |
0.1574 times |
Mon 30 June 2025 |
50.48 (6.77%) |
47.56 |
47.55 - 50.51 |
0.7512 times |
Fri 30 May 2025 |
47.28 (4.35%) |
45.38 |
45.38 - 48.05 |
0.507 times |
Wed 30 April 2025 |
45.31 (0.4%) |
44.95 |
39.86 - 45.38 |
1.8534 times |
Mon 31 March 2025 |
45.13 (1.12%) |
44.96 |
44.08 - 46.78 |
1.6311 times |
Fri 28 February 2025 |
44.63 (0.54%) |
43.57 |
43.57 - 46.72 |
0.2368 times |
Fri 31 January 2025 |
44.39 (2.56%) |
43.58 |
42.51 - 44.87 |
0.924 times |
Tue 31 December 2024 |
43.28 (-4.67%) |
47.09 |
43.23 - 47.09 |
1.0815 times |

DMA SMA EMA moving averages of Goldman Sachs GSEE
DMA (daily moving average) of Goldman Sachs GSEE
| DMA period | DMA value | | 5 day DMA | 56.86 | | 12 day DMA | 56.35 | | 20 day DMA | 56.24 | | 35 day DMA | 55.63 | | 50 day DMA | 54.67 | | 100 day DMA | 52.58 | | 150 day DMA | 50.14 | | 200 day DMA | 48.85 | EMA (exponential moving average) of Goldman Sachs GSEE
| EMA period | EMA current | EMA prev | EMA prev2 | | 5 day EMA | 56.78 | 56.65 | 56.69 | | 12 day EMA | 56.48 | 56.38 | 56.35 | | 20 day EMA | 56.16 | 56.07 | 56.02 | | 35 day EMA | 55.4 | 55.3 | 55.23 | | 50 day EMA | 54.69 | 54.59 | 54.51 |
SMA (simple moving average) of Goldman Sachs GSEE
| SMA period | SMA current | SMA prev | SMA prev2 | | 5 day SMA | 56.86 | 56.79 | 56.74 | | 12 day SMA | 56.35 | 56.3 | 56.32 | | 20 day SMA | 56.24 | 56.15 | 56.09 | | 35 day SMA | 55.63 | 55.49 | 55.37 | | 50 day SMA | 54.67 | 54.57 | 54.5 | | 100 day SMA | 52.58 | 52.48 | 52.39 | | 150 day SMA | 50.14 | 50.07 | 50 | | 200 day SMA | 48.85 | 48.78 | 48.72 |
|
|
