GsConnect GSC full analysis,charts,indicators,moving averages,SMA,DMA,EMA,ADX,MACD,RSIGs Connect GSC WideScreen charts, DMA,SMA,EMA technical analysis, forecast prediction, by indicators ADX,MACD,RSI,CCI AMEX stock exchange
Daily price and charts and targets GsConnect Strong Daily Stock price targets for GsConnect GSC are 54.04 and 54.32 | Daily Target 1 | 53.99 | | Daily Target 2 | 54.09 | | Daily Target 3 | 54.273333333333 | | Daily Target 4 | 54.37 | | Daily Target 5 | 54.55 |
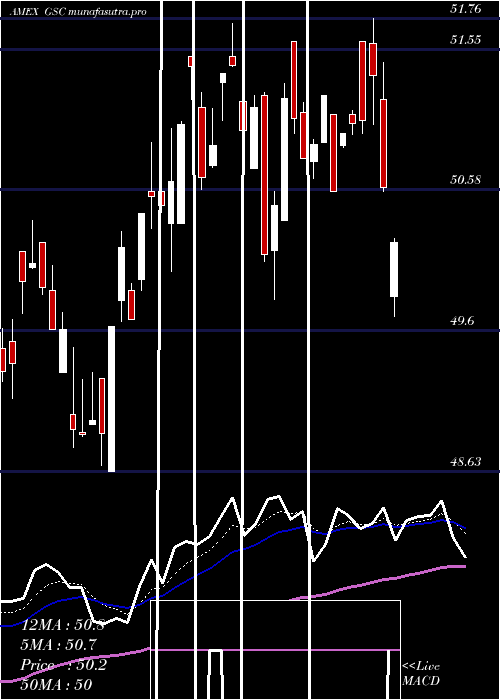
Daily price and volume Gs Connect
| Date |
Closing |
Open |
Range |
Volume |
Fri 24 October 2025 |
54.18 (0.88%) |
54.46 |
54.18 - 54.46 |
0.276 times |
Thu 23 October 2025 |
53.71 (1.72%) |
53.16 |
53.16 - 53.71 |
0.314 times |
Wed 22 October 2025 |
52.80 (-1.49%) |
53.82 |
52.43 - 53.82 |
0.6767 times |
Tue 21 October 2025 |
53.60 (0.17%) |
53.41 |
53.41 - 53.69 |
0.6095 times |
Mon 20 October 2025 |
53.51 (1.4%) |
53.40 |
53.40 - 53.57 |
0.0392 times |
Fri 17 October 2025 |
52.77 (-0.02%) |
52.88 |
52.68 - 52.88 |
0.2201 times |
Thu 16 October 2025 |
52.78 (-1.18%) |
53.38 |
52.31 - 53.41 |
2.7603 times |
Wed 15 October 2025 |
53.41 (0.26%) |
53.94 |
53.11 - 53.94 |
4.3119 times |
Tue 14 October 2025 |
53.27 (1.22%) |
52.56 |
52.56 - 53.43 |
0.6475 times |
Mon 13 October 2025 |
52.63 (2.31%) |
52.63 |
52.34 - 52.68 |
0.1447 times |
Fri 10 October 2025 |
51.44 (-2.76%) |
53.07 |
51.44 - 53.07 |
0.3961 times |
Weekly price and charts GsConnect Strong weekly Stock price targets for GsConnect GSC are 53.31 and 55.34 | Weekly Target 1 | 51.66 | | Weekly Target 2 | 52.92 | | Weekly Target 3 | 53.69 | | Weekly Target 4 | 54.95 | | Weekly Target 5 | 55.72 |
Weekly price and volumes for Gs Connect
| Date |
Closing |
Open |
Range |
Volume |
Fri 24 October 2025 |
54.18 (2.67%) |
53.40 |
52.43 - 54.46 |
0.5349 times |
Fri 17 October 2025 |
52.77 (2.59%) |
52.63 |
52.31 - 53.94 |
2.2578 times |
Fri 10 October 2025 |
51.44 (-3.98%) |
53.00 |
51.44 - 54.00 |
0.8564 times |
Fri 03 October 2025 |
53.57 (0.58%) |
53.09 |
52.85 - 53.96 |
2.6722 times |
Fri 26 September 2025 |
53.26 (-1.64%) |
54.27 |
52.44 - 54.59 |
0.5234 times |
Fri 19 September 2025 |
54.15 (0.95%) |
53.64 |
53.19 - 54.95 |
1.0553 times |
Fri 12 September 2025 |
53.64 (-0.52%) |
53.98 |
53.37 - 54.40 |
1.1936 times |
Fri 05 September 2025 |
53.92 (0.6%) |
52.99 |
52.85 - 53.92 |
0.2723 times |
Fri 29 August 2025 |
53.60 (0%) |
53.60 |
53.54 - 53.71 |
0.0426 times |
Fri 29 August 2025 |
53.60 (-0.43%) |
54.17 |
53.27 - 54.17 |
0.5915 times |
Fri 22 August 2025 |
53.83 (3.54%) |
51.89 |
51.71 - 53.90 |
1.0957 times |

Monthly price and charts GsConnect Strong monthly Stock price targets for GsConnect GSC are 52.81 and 55.83 | Monthly Target 1 | 50.34 | | Monthly Target 2 | 52.26 | | Monthly Target 3 | 53.36 | | Monthly Target 4 | 55.28 | | Monthly Target 5 | 56.38 |
Monthly price and volumes Gs Connect
| Date |
Closing |
Open |
Range |
Volume |
Fri 24 October 2025 |
54.18 (1.69%) |
53.21 |
51.44 - 54.46 |
0.8815 times |
Tue 30 September 2025 |
53.28 (-0.6%) |
52.99 |
52.44 - 54.95 |
0.4858 times |
Fri 29 August 2025 |
53.60 (5.95%) |
49.84 |
49.70 - 54.17 |
0.5861 times |
Thu 31 July 2025 |
50.59 (0.24%) |
50.34 |
49.82 - 51.76 |
1.0754 times |
Mon 30 June 2025 |
50.47 (3.51%) |
48.96 |
48.43 - 50.90 |
0.7476 times |
Fri 30 May 2025 |
48.76 (7.05%) |
46.16 |
46.07 - 49.86 |
0.6697 times |
Wed 30 April 2025 |
45.55 (-2.3%) |
46.41 |
40.49 - 47.79 |
1.7623 times |
Mon 31 March 2025 |
46.62 (-6.55%) |
49.95 |
45.56 - 49.95 |
1.8155 times |
Fri 28 February 2025 |
49.89 (-6.1%) |
51.71 |
49.06 - 53.72 |
0.9153 times |
Fri 31 January 2025 |
53.13 (3.65%) |
52.07 |
49.65 - 54.04 |
1.0608 times |
Tue 31 December 2024 |
51.26 (-8.48%) |
56.19 |
50.71 - 56.19 |
1.5934 times |

DMA SMA EMA moving averages of Gs Connect GSC
DMA (daily moving average) of Gs Connect GSC
| DMA period | DMA value | | 5 day DMA | 53.56 | | 12 day DMA | 53.08 | | 20 day DMA | 53.19 | | 35 day DMA | 53.43 | | 50 day DMA | 53.37 | | 100 day DMA | 51.97 | | 150 day DMA | 50.07 | | 200 day DMA | 50.23 | EMA (exponential moving average) of Gs Connect GSC
| EMA period | EMA current | EMA prev | EMA prev2 | | 5 day EMA | 53.6 | 53.31 | 53.11 | | 12 day EMA | 53.34 | 53.19 | 53.1 | | 20 day EMA | 53.28 | 53.19 | 53.14 | | 35 day EMA | 53.25 | 53.2 | 53.17 | | 50 day EMA | 53.27 | 53.23 | 53.21 |
SMA (simple moving average) of Gs Connect GSC
| SMA period | SMA current | SMA prev | SMA prev2 | | 5 day SMA | 53.56 | 53.28 | 53.09 | | 12 day SMA | 53.08 | 53.04 | 52.98 | | 20 day SMA | 53.19 | 53.14 | 53.09 | | 35 day SMA | 53.43 | 53.42 | 53.42 | | 50 day SMA | 53.37 | 53.32 | 53.3 | | 100 day SMA | 51.97 | 51.92 | 51.87 | | 150 day SMA | 50.07 | 50.02 | 49.98 | | 200 day SMA | 50.23 | 50.22 | 50.21 |
|
|
