GreenBond GRNB full analysis,charts,indicators,moving averages,SMA,DMA,EMA,ADX,MACD,RSIGreen Bond GRNB WideScreen charts, DMA,SMA,EMA technical analysis, forecast prediction, by indicators ADX,MACD,RSI,CCI AMEX stock exchange
Daily price and charts and targets GreenBond Strong Daily Stock price targets for GreenBond GRNB are 24.5 and 24.57 | Daily Target 1 | 24.46 | | Daily Target 2 | 24.5 | | Daily Target 3 | 24.533333333333 | | Daily Target 4 | 24.57 | | Daily Target 5 | 24.6 |
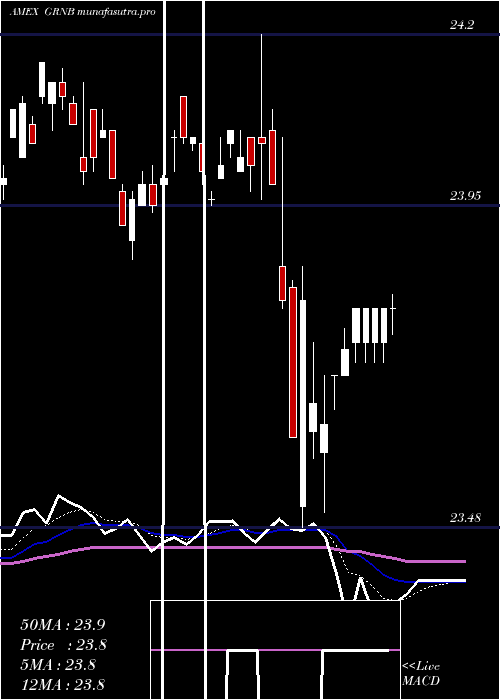
Daily price and volume Green Bond
| Date |
Closing |
Open |
Range |
Volume |
Thu 23 October 2025 |
24.53 (-0.04%) |
24.53 |
24.50 - 24.57 |
0.1493 times |
Wed 22 October 2025 |
24.54 (-0.12%) |
24.57 |
24.51 - 24.57 |
0.546 times |
Tue 21 October 2025 |
24.57 (0.12%) |
24.55 |
24.54 - 24.58 |
0.9587 times |
Mon 20 October 2025 |
24.54 (0.12%) |
24.48 |
24.48 - 24.55 |
0.33 times |
Fri 17 October 2025 |
24.51 (-0.08%) |
24.48 |
24.48 - 24.51 |
0.1239 times |
Thu 16 October 2025 |
24.53 (0.16%) |
24.46 |
24.44 - 24.53 |
0.9197 times |
Wed 15 October 2025 |
24.49 (0.12%) |
24.53 |
24.48 - 24.54 |
0.9512 times |
Tue 14 October 2025 |
24.46 (0.12%) |
24.45 |
24.39 - 24.47 |
0.2668 times |
Mon 13 October 2025 |
24.43 (0.21%) |
24.37 |
24.35 - 24.43 |
0.3558 times |
Fri 10 October 2025 |
24.38 (0.21%) |
24.36 |
24.32 - 24.67 |
5.3986 times |
Thu 09 October 2025 |
24.33 (-0.33%) |
24.42 |
24.32 - 24.42 |
0.509 times |
Weekly price and charts GreenBond Strong weekly Stock price targets for GreenBond GRNB are 24.51 and 24.61 | Weekly Target 1 | 24.43 | | Weekly Target 2 | 24.48 | | Weekly Target 3 | 24.53 | | Weekly Target 4 | 24.58 | | Weekly Target 5 | 24.63 |
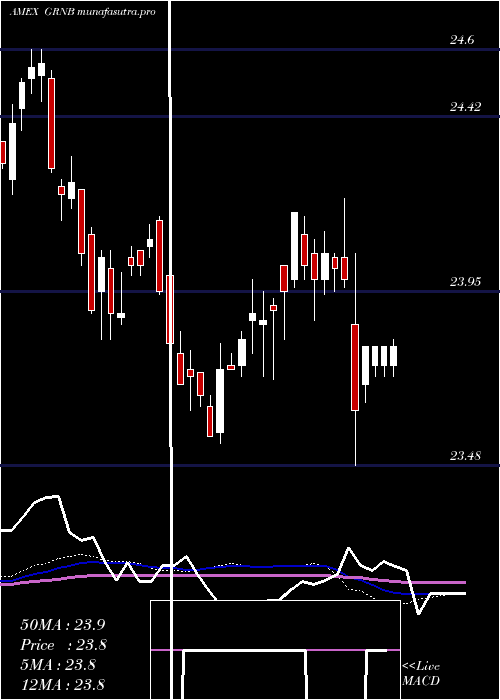
Weekly price and volumes for Green Bond
| Date |
Closing |
Open |
Range |
Volume |
Thu 23 October 2025 |
24.53 (0.08%) |
24.48 |
24.48 - 24.58 |
0.6493 times |
Fri 17 October 2025 |
24.51 (0.53%) |
24.37 |
24.35 - 24.54 |
0.8567 times |
Fri 10 October 2025 |
24.38 (-0.12%) |
24.38 |
24.32 - 24.67 |
2.4024 times |
Fri 03 October 2025 |
24.41 (-0.08%) |
24.49 |
24.38 - 24.49 |
0.6713 times |
Fri 26 September 2025 |
24.43 (-0.45%) |
24.47 |
24.39 - 24.60 |
0.5345 times |
Fri 19 September 2025 |
24.54 (0.08%) |
24.55 |
24.48 - 24.63 |
1.1176 times |
Fri 12 September 2025 |
24.52 (0.33%) |
24.46 |
24.44 - 24.63 |
0.7043 times |
Fri 05 September 2025 |
24.44 (0.29%) |
24.20 |
24.20 - 24.46 |
0.6696 times |
Fri 29 August 2025 |
24.37 (0%) |
24.35 |
24.35 - 24.40 |
0.3801 times |
Fri 29 August 2025 |
24.37 (0%) |
24.33 |
24.29 - 24.44 |
2.0143 times |
Fri 22 August 2025 |
24.37 (0.33%) |
24.27 |
24.23 - 24.38 |
0.6849 times |
Monthly price and charts GreenBond Strong monthly Stock price targets for GreenBond GRNB are 24.43 and 24.78 | Monthly Target 1 | 24.16 | | Monthly Target 2 | 24.34 | | Monthly Target 3 | 24.506666666667 | | Monthly Target 4 | 24.69 | | Monthly Target 5 | 24.86 |
Monthly price and volumes Green Bond
| Date |
Closing |
Open |
Range |
Volume |
Thu 23 October 2025 |
24.53 (0.41%) |
24.41 |
24.32 - 24.67 |
1.2181 times |
Tue 30 September 2025 |
24.43 (0.25%) |
24.20 |
24.20 - 24.63 |
0.901 times |
Fri 29 August 2025 |
24.37 (0.7%) |
24.19 |
24.17 - 24.44 |
1.166 times |
Thu 31 July 2025 |
24.20 (-0.17%) |
24.13 |
23.99 - 24.26 |
0.8457 times |
Mon 30 June 2025 |
24.24 (1.13%) |
23.85 |
23.82 - 24.24 |
0.5534 times |
Fri 30 May 2025 |
23.97 (-0.29%) |
23.93 |
23.71 - 23.99 |
1.0741 times |
Wed 30 April 2025 |
24.04 (-0.08%) |
24.00 |
23.48 - 24.20 |
1.1539 times |
Mon 31 March 2025 |
24.06 (-0.41%) |
24.10 |
23.87 - 24.15 |
0.6794 times |
Fri 28 February 2025 |
24.16 (1.13%) |
23.86 |
23.71 - 24.16 |
0.869 times |
Fri 31 January 2025 |
23.89 (0.8%) |
23.74 |
23.54 - 23.98 |
1.5394 times |
Tue 31 December 2024 |
23.70 (-1.33%) |
24.07 |
23.63 - 24.15 |
0.8896 times |

DMA SMA EMA moving averages of Green Bond GRNB
DMA (daily moving average) of Green Bond GRNB
| DMA period | DMA value | | 5 day DMA | 24.54 | | 12 day DMA | 24.48 | | 20 day DMA | 24.46 | | 35 day DMA | 24.48 | | 50 day DMA | 24.43 | | 100 day DMA | 24.27 | | 150 day DMA | 24.14 | | 200 day DMA | 24.07 | EMA (exponential moving average) of Green Bond GRNB
| EMA period | EMA current | EMA prev | EMA prev2 | | 5 day EMA | 24.53 | 24.53 | 24.52 | | 12 day EMA | 24.5 | 24.5 | 24.49 | | 20 day EMA | 24.49 | 24.49 | 24.48 | | 35 day EMA | 24.46 | 24.46 | 24.45 | | 50 day EMA | 24.43 | 24.43 | 24.43 |
SMA (simple moving average) of Green Bond GRNB
| SMA period | SMA current | SMA prev | SMA prev2 | | 5 day SMA | 24.54 | 24.54 | 24.53 | | 12 day SMA | 24.48 | 24.47 | 24.46 | | 20 day SMA | 24.46 | 24.45 | 24.45 | | 35 day SMA | 24.48 | 24.47 | 24.46 | | 50 day SMA | 24.43 | 24.43 | 24.42 | | 100 day SMA | 24.27 | 24.27 | 24.26 | | 150 day SMA | 24.14 | 24.13 | 24.13 | | 200 day SMA | 24.07 | 24.07 | 24.07 |
|
|
