FlexsharesGlobal GQRE full analysis,charts,indicators,moving averages,SMA,DMA,EMA,ADX,MACD,RSIFlexshares Global GQRE WideScreen charts, DMA,SMA,EMA technical analysis, forecast prediction, by indicators ADX,MACD,RSI,CCI AMEX stock exchange
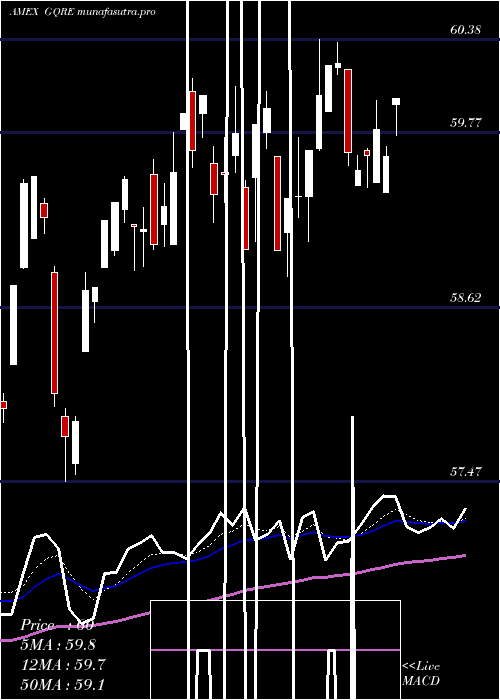
Daily price and charts and targets FlexsharesGlobal Strong Daily Stock price targets for FlexsharesGlobal GQRE are 61.05 and 61.22 | Daily Target 1 | 61.02 | | Daily Target 2 | 61.07 | | Daily Target 3 | 61.186666666667 | | Daily Target 4 | 61.24 | | Daily Target 5 | 61.36 |
Daily price and volume Flexshares Global
| Date |
Closing |
Open |
Range |
Volume |
Fri 24 October 2025 |
61.13 (0.05%) |
61.19 |
61.13 - 61.30 |
0.241 times |
Thu 23 October 2025 |
61.10 (0.36%) |
61.11 |
60.74 - 61.20 |
0.3244 times |
Wed 22 October 2025 |
60.88 (0.36%) |
60.75 |
60.66 - 61.01 |
0.3762 times |
Tue 21 October 2025 |
60.66 (-0.36%) |
60.79 |
60.56 - 60.88 |
0.1565 times |
Mon 20 October 2025 |
60.88 (0.53%) |
60.75 |
60.64 - 60.88 |
0.3411 times |
Fri 17 October 2025 |
60.56 (0.56%) |
60.23 |
60.13 - 60.56 |
7.1627 times |
Thu 16 October 2025 |
60.22 (0.02%) |
60.37 |
60.18 - 60.55 |
0.4486 times |
Wed 15 October 2025 |
60.21 (0.62%) |
59.85 |
59.85 - 60.40 |
0.3495 times |
Tue 14 October 2025 |
59.84 (0.59%) |
59.41 |
59.41 - 59.93 |
0.2921 times |
Mon 13 October 2025 |
59.49 (-1.15%) |
59.46 |
59.44 - 59.51 |
0.3078 times |
Tue 07 October 2025 |
60.18 (-0.63%) |
60.16 |
60.10 - 60.40 |
0.2087 times |
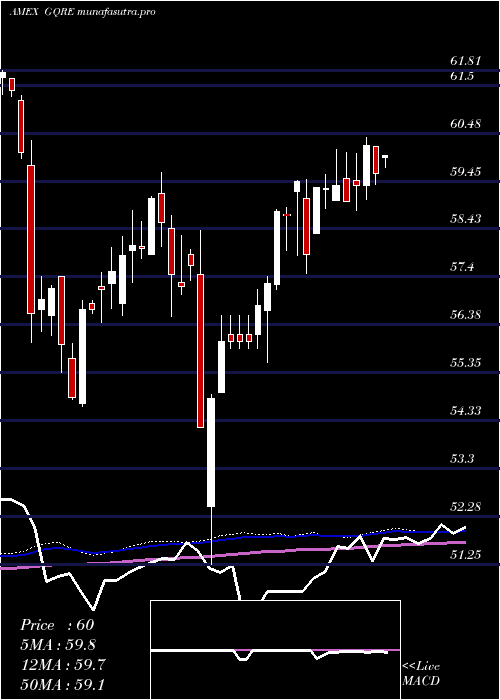
Weekly price and charts FlexsharesGlobal Strong weekly Stock price targets for FlexsharesGlobal GQRE are 60.85 and 61.59 | Weekly Target 1 | 60.26 | | Weekly Target 2 | 60.69 | | Weekly Target 3 | 60.996666666667 | | Weekly Target 4 | 61.43 | | Weekly Target 5 | 61.74 |
Weekly price and volumes for Flexshares Global
| Date |
Closing |
Open |
Range |
Volume |
Fri 24 October 2025 |
61.13 (0.94%) |
60.75 |
60.56 - 61.30 |
0.5173 times |
Fri 17 October 2025 |
60.56 (0.63%) |
59.46 |
59.41 - 60.56 |
3.077 times |
Tue 07 October 2025 |
60.18 (-1.31%) |
60.94 |
60.10 - 60.94 |
0.1409 times |
Fri 03 October 2025 |
60.98 (0.88%) |
60.55 |
60.37 - 61.31 |
1.296 times |
Fri 26 September 2025 |
60.45 (0%) |
60.07 |
59.80 - 60.69 |
1.3463 times |
Fri 19 September 2025 |
60.45 (-2.11%) |
61.88 |
60.45 - 61.88 |
0.9694 times |
Fri 12 September 2025 |
61.75 (1.01%) |
61.16 |
60.76 - 62.02 |
0.7781 times |
Fri 05 September 2025 |
61.13 (-0.16%) |
60.48 |
60.09 - 61.17 |
0.6431 times |
Fri 29 August 2025 |
61.23 (0%) |
61.05 |
61.04 - 61.23 |
0.1481 times |
Fri 29 August 2025 |
61.23 (-0.1%) |
61.12 |
60.65 - 61.23 |
1.0838 times |
Fri 22 August 2025 |
61.29 (2.25%) |
59.99 |
59.57 - 61.42 |
1.0725 times |
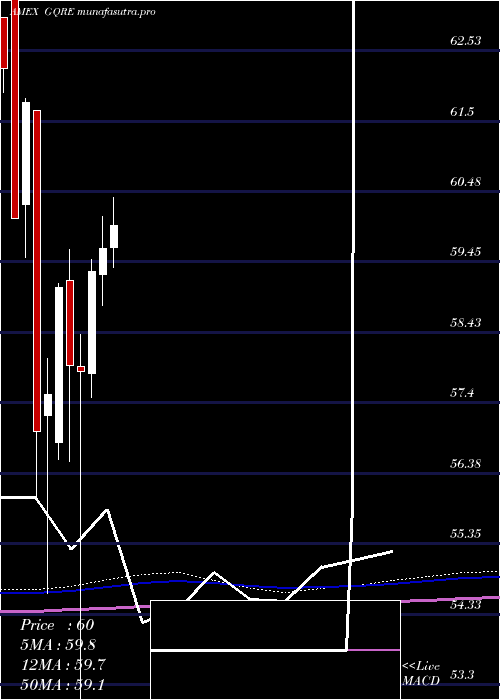
Monthly price and charts FlexsharesGlobal Strong monthly Stock price targets for FlexsharesGlobal GQRE are 60.27 and 62.17 | Monthly Target 1 | 58.72 | | Monthly Target 2 | 59.92 | | Monthly Target 3 | 60.616666666667 | | Monthly Target 4 | 61.82 | | Monthly Target 5 | 62.52 |
Monthly price and volumes Flexshares Global
| Date |
Closing |
Open |
Range |
Volume |
Fri 24 October 2025 |
61.13 (0.28%) |
61.07 |
59.41 - 61.31 |
0.5823 times |
Tue 30 September 2025 |
60.96 (-0.44%) |
60.48 |
59.80 - 62.02 |
0.5646 times |
Fri 29 August 2025 |
61.23 (4.29%) |
58.75 |
58.41 - 61.42 |
0.5438 times |
Thu 31 July 2025 |
58.71 (-1.58%) |
59.66 |
58.71 - 61.01 |
1.1175 times |
Mon 30 June 2025 |
59.65 (0.57%) |
59.26 |
58.82 - 60.12 |
1.5816 times |
Fri 30 May 2025 |
59.31 (2.51%) |
57.83 |
57.47 - 59.48 |
0.8497 times |
Wed 30 April 2025 |
57.86 (-0.16%) |
57.93 |
51.25 - 58.39 |
1.3837 times |
Mon 31 March 2025 |
57.95 (-1.91%) |
59.18 |
56.55 - 59.63 |
0.7169 times |
Fri 28 February 2025 |
59.08 (2.71%) |
56.83 |
56.58 - 59.13 |
0.8945 times |
Fri 31 January 2025 |
57.52 (0.95%) |
57.22 |
54.63 - 58.04 |
1.7654 times |
Tue 31 December 2024 |
56.98 (-7.75%) |
61.65 |
56.00 - 61.65 |
1.0772 times |
DMA SMA EMA moving averages of Flexshares Global GQRE
DMA (daily moving average) of Flexshares Global GQRE
| DMA period | DMA value | | 5 day DMA | 60.93 | | 12 day DMA | 60.48 | | 20 day DMA | 60.52 | | 35 day DMA | 60.75 | | 50 day DMA | 60.69 | | 100 day DMA | 60.17 | | 150 day DMA | 59.19 | | 200 day DMA | 58.78 | EMA (exponential moving average) of Flexshares Global GQRE
| EMA period | EMA current | EMA prev | EMA prev2 | | 5 day EMA | 60.92 | 60.81 | 60.66 | | 12 day EMA | 60.71 | 60.63 | 60.54 | | 20 day EMA | 60.65 | 60.6 | 60.55 | | 35 day EMA | 60.59 | 60.56 | 60.53 | | 50 day EMA | 60.61 | 60.59 | 60.57 |
SMA (simple moving average) of Flexshares Global GQRE
| SMA period | SMA current | SMA prev | SMA prev2 | | 5 day SMA | 60.93 | 60.82 | 60.64 | | 12 day SMA | 60.48 | 60.46 | 60.44 | | 20 day SMA | 60.52 | 60.5 | 60.47 | | 35 day SMA | 60.75 | 60.72 | 60.73 | | 50 day SMA | 60.69 | 60.66 | 60.63 | | 100 day SMA | 60.17 | 60.14 | 60.12 | | 150 day SMA | 59.19 | 59.17 | 59.15 | | 200 day SMA | 58.78 | 58.76 | 58.74 |
|
|
