GabelliGlobal GLU-B full analysis,charts,indicators,moving averages,SMA,DMA,EMA,ADX,MACD,RSIGabelli Global GLU-B WideScreen charts, DMA,SMA,EMA technical analysis, forecast prediction, by indicators ADX,MACD,RSI,CCI AMEX stock exchange
Daily price and charts and targets GabelliGlobal Strong Daily Stock price targets for GabelliGlobal GLU-B are 50.26 and 50.29 | Daily Target 1 | 50.25 | | Daily Target 2 | 50.27 | | Daily Target 3 | 50.283333333333 | | Daily Target 4 | 50.3 | | Daily Target 5 | 50.31 |
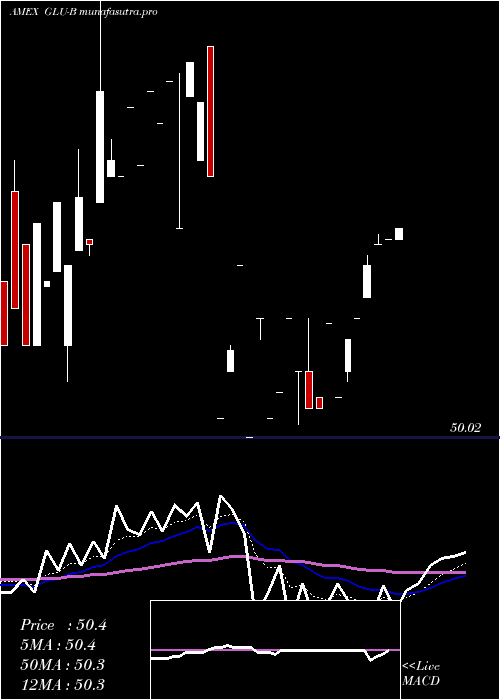
Daily price and volume Gabelli Global
| Date |
Closing |
Open |
Range |
Volume |
Fri 24 October 2025 |
50.28 (-0.04%) |
50.30 |
50.27 - 50.30 |
1.1111 times |
Thu 23 October 2025 |
50.30 (0.06%) |
50.28 |
50.28 - 50.30 |
1.4379 times |
Wed 22 October 2025 |
50.27 (-0.04%) |
50.27 |
50.27 - 50.27 |
0.1307 times |
Tue 21 October 2025 |
50.29 (0.08%) |
50.27 |
50.27 - 50.29 |
0.8497 times |
Mon 20 October 2025 |
50.25 (-0.1%) |
50.25 |
50.25 - 50.25 |
0.3922 times |
Fri 17 October 2025 |
50.30 (0.06%) |
50.26 |
50.24 - 50.30 |
0.5229 times |
Wed 15 October 2025 |
50.27 (0.06%) |
50.27 |
50.27 - 50.27 |
0.1307 times |
Mon 13 October 2025 |
50.24 (-0.12%) |
50.26 |
50.24 - 50.26 |
1.1111 times |
Fri 10 October 2025 |
50.30 (0%) |
50.30 |
50.28 - 50.30 |
0.5882 times |
Thu 09 October 2025 |
50.30 (0%) |
50.30 |
50.27 - 50.30 |
3.7255 times |
Wed 08 October 2025 |
50.30 (0.14%) |
50.30 |
50.30 - 50.30 |
0.8497 times |
Weekly price and charts GabelliGlobal Strong weekly Stock price targets for GabelliGlobal GLU-B are 50.27 and 50.32 | Weekly Target 1 | 50.23 | | Weekly Target 2 | 50.25 | | Weekly Target 3 | 50.276666666667 | | Weekly Target 4 | 50.3 | | Weekly Target 5 | 50.33 |
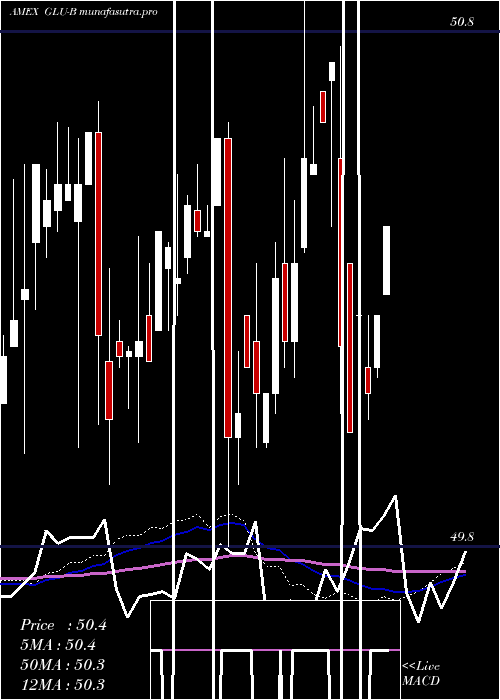
Weekly price and volumes for Gabelli Global
| Date |
Closing |
Open |
Range |
Volume |
Fri 24 October 2025 |
50.28 (-0.04%) |
50.25 |
50.25 - 50.30 |
2.2901 times |
Fri 17 October 2025 |
50.30 (0%) |
50.26 |
50.24 - 50.30 |
1.0305 times |
Fri 10 October 2025 |
50.30 (-0.12%) |
50.20 |
50.20 - 50.30 |
3.2443 times |
Thu 25 September 2025 |
50.36 (-0.36%) |
50.85 |
50.20 - 50.85 |
1.8702 times |
Fri 05 September 2025 |
50.54 (-0.02%) |
50.54 |
50.54 - 50.54 |
0.0382 times |
Fri 29 August 2025 |
50.55 (0%) |
50.55 |
50.55 - 50.55 |
0.1908 times |
Fri 29 August 2025 |
50.55 (0.36%) |
50.55 |
50.55 - 50.55 |
0.3817 times |
Fri 15 August 2025 |
50.37 (-0.16%) |
50.34 |
50.34 - 50.44 |
0.687 times |
Fri 08 August 2025 |
50.45 (0.26%) |
50.45 |
50.44 - 50.45 |
0.1908 times |
Wed 16 July 2025 |
50.32 (-0.12%) |
50.32 |
50.32 - 50.32 |
0.0763 times |
Fri 11 July 2025 |
50.38 (0.36%) |
50.21 |
50.21 - 50.38 |
0.5344 times |
Monthly price and charts GabelliGlobal Strong monthly Stock price targets for GabelliGlobal GLU-B are 50.26 and 50.33 | Monthly Target 1 | 50.2 | | Monthly Target 2 | 50.24 | | Monthly Target 3 | 50.27 | | Monthly Target 4 | 50.31 | | Monthly Target 5 | 50.34 |
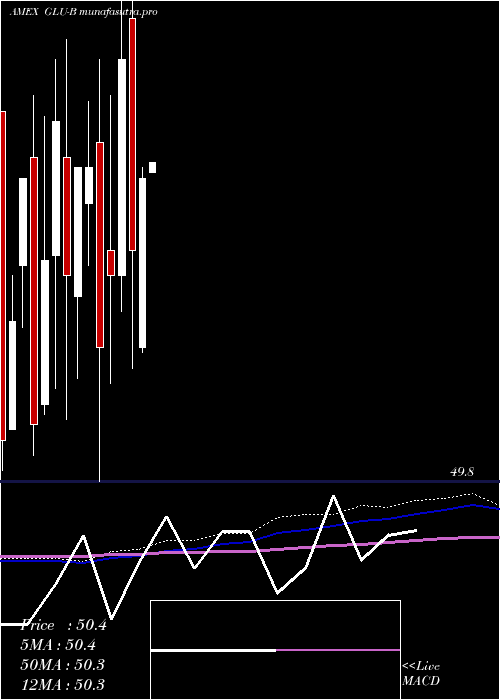
Monthly price and volumes Gabelli Global
| Date |
Closing |
Open |
Range |
Volume |
Fri 24 October 2025 |
50.28 (0.16%) |
50.23 |
50.23 - 50.30 |
1.2811 times |
Mon 29 September 2025 |
50.20 (-0.69%) |
50.54 |
50.20 - 50.85 |
0.4219 times |
Fri 29 August 2025 |
50.55 (0.46%) |
50.45 |
50.34 - 50.55 |
0.2915 times |
Wed 16 July 2025 |
50.32 (0.24%) |
50.21 |
50.21 - 50.38 |
0.1227 times |
Thu 26 June 2025 |
50.20 (-0.85%) |
50.45 |
50.13 - 50.69 |
0.8208 times |
Fri 30 May 2025 |
50.63 (0.48%) |
50.40 |
50.40 - 51.18 |
1.4422 times |
Wed 30 April 2025 |
50.39 (0.28%) |
50.06 |
50.05 - 50.41 |
1.051 times |
Mon 31 March 2025 |
50.25 (-0.73%) |
50.70 |
50.02 - 50.77 |
0.3912 times |
Wed 26 February 2025 |
50.62 (0.84%) |
50.20 |
50.13 - 51.00 |
1.7107 times |
Fri 31 January 2025 |
50.20 (0.28%) |
50.25 |
49.99 - 50.55 |
2.4667 times |
Thu 26 December 2024 |
50.06 (-0.69%) |
50.46 |
49.80 - 50.62 |
5.1775 times |
DMA SMA EMA moving averages of Gabelli Global GLU-B
DMA (daily moving average) of Gabelli Global GLU-B
| DMA period | DMA value | | 5 day DMA | 50.28 | | 12 day DMA | 50.28 | | 20 day DMA | 50.36 | | 35 day DMA | 50.34 | | 50 day DMA | 50.42 | | 100 day DMA | 50.41 | | 150 day DMA | 50.37 | | 200 day DMA | 50.36 | EMA (exponential moving average) of Gabelli Global GLU-B
| EMA period | EMA current | EMA prev | EMA prev2 | | 5 day EMA | 50.29 | 50.29 | 50.28 | | 12 day EMA | 50.31 | 50.31 | 50.31 | | 20 day EMA | 50.33 | 50.33 | 50.33 | | 35 day EMA | 50.36 | 50.36 | 50.36 | | 50 day EMA | 50.41 | 50.42 | 50.42 |
SMA (simple moving average) of Gabelli Global GLU-B
| SMA period | SMA current | SMA prev | SMA prev2 | | 5 day SMA | 50.28 | 50.28 | 50.28 | | 12 day SMA | 50.28 | 50.27 | 50.28 | | 20 day SMA | 50.36 | 50.36 | 50.37 | | 35 day SMA | 50.34 | 50.35 | 50.36 | | 50 day SMA | 50.42 | 50.42 | 50.43 | | 100 day SMA | 50.41 | 50.41 | 50.41 | | 150 day SMA | 50.37 | 50.37 | 50.37 | | 200 day SMA | 50.36 | 50.36 | 50.36 |
|
|
