IndiaSmallcap GLIN full analysis,charts,indicators,moving averages,SMA,DMA,EMA,ADX,MACD,RSIIndia Smallcap GLIN WideScreen charts, DMA,SMA,EMA technical analysis, forecast prediction, by indicators ADX,MACD,RSI,CCI AMEX stock exchange
Daily price and charts and targets IndiaSmallcap Strong Daily Stock price targets for IndiaSmallcap GLIN are 46.35 and 46.71 | Daily Target 1 | 46.24 | | Daily Target 2 | 46.45 | | Daily Target 3 | 46.603333333333 | | Daily Target 4 | 46.81 | | Daily Target 5 | 46.96 |
Daily price and volume India Smallcap
| Date |
Closing |
Open |
Range |
Volume |
Thu 23 October 2025 |
46.65 (-1.25%) |
46.76 |
46.40 - 46.76 |
0.9567 times |
Wed 22 October 2025 |
47.24 (1.94%) |
46.99 |
46.99 - 47.44 |
1.3951 times |
Tue 21 October 2025 |
46.34 (-0.64%) |
46.27 |
46.27 - 46.46 |
0.7258 times |
Mon 20 October 2025 |
46.64 (0.89%) |
46.43 |
46.39 - 46.70 |
0.9069 times |
Fri 17 October 2025 |
46.23 (0.78%) |
45.96 |
45.94 - 46.29 |
0.7971 times |
Thu 16 October 2025 |
45.87 (0.22%) |
45.93 |
45.79 - 46.02 |
0.5326 times |
Wed 15 October 2025 |
45.77 (1.62%) |
45.69 |
45.62 - 45.81 |
0.8441 times |
Tue 14 October 2025 |
45.04 (-0.77%) |
45.10 |
44.88 - 45.15 |
0.994 times |
Mon 13 October 2025 |
45.39 (0.46%) |
45.45 |
45.30 - 45.45 |
0.9387 times |
Fri 10 October 2025 |
45.18 (-0.02%) |
45.65 |
45.05 - 45.75 |
1.909 times |
Thu 09 October 2025 |
45.19 (0.51%) |
45.24 |
45.00 - 45.24 |
0.71 times |
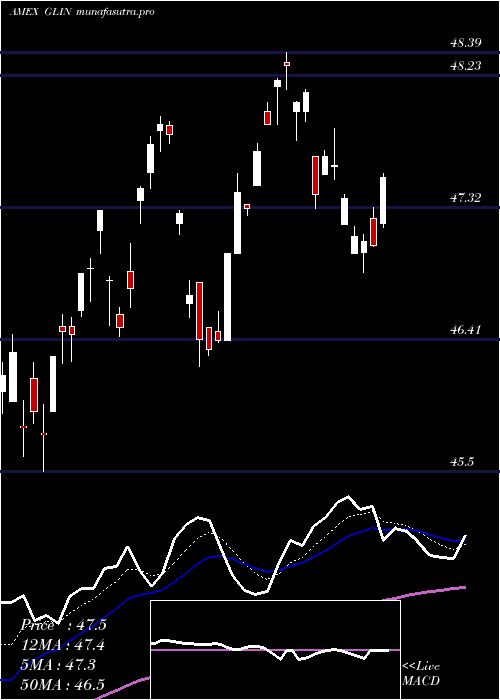
Weekly price and charts IndiaSmallcap Strong weekly Stock price targets for IndiaSmallcap GLIN are 46.46 and 47.63 | Weekly Target 1 | 45.62 | | Weekly Target 2 | 46.13 | | Weekly Target 3 | 46.786666666667 | | Weekly Target 4 | 47.3 | | Weekly Target 5 | 47.96 |
Weekly price and volumes for India Smallcap
| Date |
Closing |
Open |
Range |
Volume |
Thu 23 October 2025 |
46.65 (0.91%) |
46.43 |
46.27 - 47.44 |
0.8591 times |
Fri 17 October 2025 |
46.23 (2.32%) |
45.45 |
44.88 - 46.29 |
0.8854 times |
Fri 10 October 2025 |
45.18 (0.13%) |
45.24 |
44.92 - 45.75 |
0.9904 times |
Fri 03 October 2025 |
45.12 (0.8%) |
44.74 |
44.56 - 45.22 |
0.8375 times |
Fri 26 September 2025 |
44.76 (-3.87%) |
46.20 |
44.46 - 46.32 |
1.1872 times |
Fri 19 September 2025 |
46.56 (1.97%) |
45.76 |
45.76 - 47.02 |
1.3335 times |
Fri 12 September 2025 |
45.66 (2.31%) |
44.74 |
44.74 - 45.89 |
0.961 times |
Fri 05 September 2025 |
44.63 (1.34%) |
44.15 |
44.15 - 44.90 |
0.7195 times |
Fri 29 August 2025 |
44.04 (0%) |
44.05 |
43.90 - 44.05 |
0.0697 times |
Fri 29 August 2025 |
44.04 (-3.19%) |
45.21 |
43.90 - 45.56 |
2.1567 times |
Fri 22 August 2025 |
45.49 (1.63%) |
45.04 |
45.04 - 45.56 |
0.6531 times |
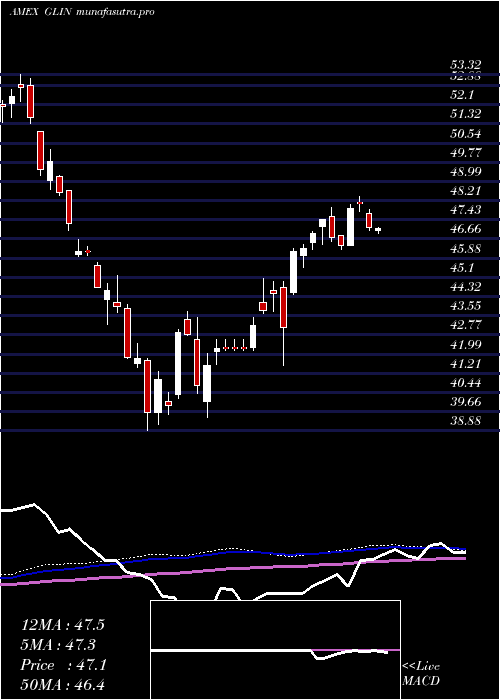
Monthly price and charts IndiaSmallcap Strong monthly Stock price targets for IndiaSmallcap GLIN are 45.74 and 48.36 | Monthly Target 1 | 43.68 | | Monthly Target 2 | 45.17 | | Monthly Target 3 | 46.303333333333 | | Monthly Target 4 | 47.79 | | Monthly Target 5 | 48.92 |
Monthly price and volumes India Smallcap
| Date |
Closing |
Open |
Range |
Volume |
Thu 23 October 2025 |
46.65 (4.48%) |
45.02 |
44.82 - 47.44 |
0.4141 times |
Tue 30 September 2025 |
44.65 (1.39%) |
44.15 |
44.15 - 47.02 |
0.5854 times |
Fri 29 August 2025 |
44.04 (-0.81%) |
44.52 |
43.90 - 45.56 |
0.7414 times |
Thu 31 July 2025 |
44.40 (-7.86%) |
48.32 |
44.40 - 48.39 |
0.8527 times |
Mon 30 June 2025 |
48.19 (2.75%) |
47.16 |
46.22 - 48.21 |
0.6292 times |
Fri 30 May 2025 |
46.90 (6.18%) |
44.35 |
41.52 - 46.97 |
1.0736 times |
Wed 30 April 2025 |
44.17 (3.03%) |
42.70 |
39.44 - 45.06 |
1.6863 times |
Mon 31 March 2025 |
42.87 (8.23%) |
39.62 |
39.13 - 43.73 |
1.1862 times |
Fri 28 February 2025 |
39.61 (-11.09%) |
44.09 |
38.88 - 45.16 |
1.6857 times |
Fri 31 January 2025 |
44.55 (-9.41%) |
50.07 |
43.20 - 50.29 |
1.1454 times |
Tue 31 December 2024 |
49.18 (-5.5%) |
52.15 |
48.67 - 53.32 |
0.8514 times |
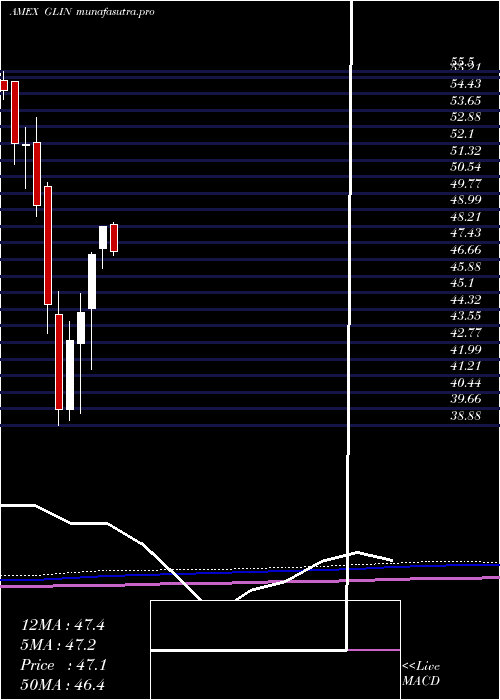
DMA SMA EMA moving averages of India Smallcap GLIN
DMA (daily moving average) of India Smallcap GLIN
| DMA period | DMA value | | 5 day DMA | 46.62 | | 12 day DMA | 45.88 | | 20 day DMA | 45.5 | | 35 day DMA | 45.59 | | 50 day DMA | 45.36 | | 100 day DMA | 45.96 | | 150 day DMA | 45.22 | | 200 day DMA | 44.66 | EMA (exponential moving average) of India Smallcap GLIN
| EMA period | EMA current | EMA prev | EMA prev2 | | 5 day EMA | 46.56 | 46.51 | 46.15 | | 12 day EMA | 46.1 | 46 | 45.77 | | 20 day EMA | 45.85 | 45.77 | 45.61 | | 35 day EMA | 45.56 | 45.5 | 45.4 | | 50 day EMA | 45.42 | 45.37 | 45.29 |
SMA (simple moving average) of India Smallcap GLIN
| SMA period | SMA current | SMA prev | SMA prev2 | | 5 day SMA | 46.62 | 46.46 | 46.17 | | 12 day SMA | 45.88 | 45.75 | 45.58 | | 20 day SMA | 45.5 | 45.42 | 45.32 | | 35 day SMA | 45.59 | 45.53 | 45.46 | | 50 day SMA | 45.36 | 45.31 | 45.27 | | 100 day SMA | 45.96 | 45.97 | 45.96 | | 150 day SMA | 45.22 | 45.19 | 45.16 | | 200 day SMA | 44.66 | 44.67 | 44.68 |
|
|
