GoldminingInc GLDG full analysis,charts,indicators,moving averages,SMA,DMA,EMA,ADX,MACD,RSIGoldmining Inc GLDG WideScreen charts, DMA,SMA,EMA technical analysis, forecast prediction, by indicators ADX,MACD,RSI,CCI AMEX stock exchange
Daily price and charts and targets GoldminingInc Strong Daily Stock price targets for GoldminingInc GLDG are 1.36 and 1.47 | Daily Target 1 | 1.33 | | Daily Target 2 | 1.38 | | Daily Target 3 | 1.4433333333333 | | Daily Target 4 | 1.49 | | Daily Target 5 | 1.55 |
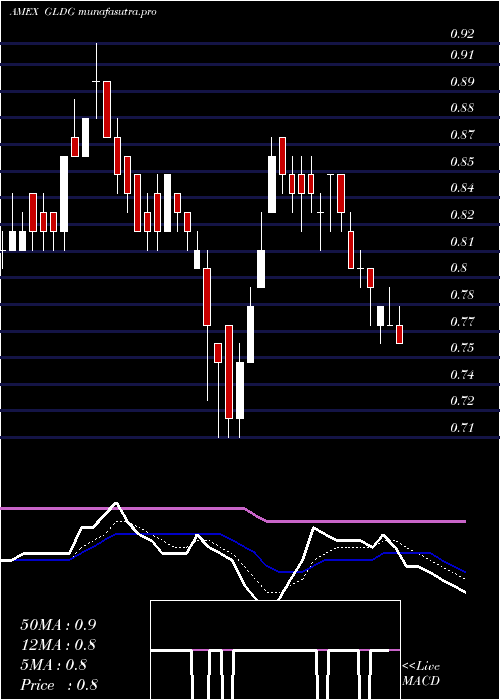
Daily price and volume Goldmining Inc
| Date |
Closing |
Open |
Range |
Volume |
Thu 23 October 2025 |
1.42 (-0.7%) |
1.47 |
1.40 - 1.51 |
0.3904 times |
Wed 22 October 2025 |
1.43 (-3.38%) |
1.42 |
1.38 - 1.47 |
0.7398 times |
Tue 21 October 2025 |
1.48 (-10.84%) |
1.57 |
1.45 - 1.61 |
0.8648 times |
Mon 20 October 2025 |
1.66 (8.5%) |
1.54 |
1.54 - 1.71 |
0.8424 times |
Fri 17 October 2025 |
1.53 (-6.71%) |
1.61 |
1.50 - 1.63 |
0.8864 times |
Thu 16 October 2025 |
1.64 (-6.29%) |
1.73 |
1.61 - 1.75 |
0.998 times |
Wed 15 October 2025 |
1.75 (5.42%) |
1.68 |
1.65 - 1.75 |
1.2525 times |
Tue 14 October 2025 |
1.66 (-4.05%) |
1.66 |
1.65 - 1.77 |
1.2908 times |
Mon 13 October 2025 |
1.73 (1.17%) |
1.79 |
1.62 - 1.79 |
1.1707 times |
Fri 10 October 2025 |
1.71 (4.27%) |
1.72 |
1.61 - 1.76 |
1.5641 times |
Thu 09 October 2025 |
1.64 (0%) |
1.79 |
1.59 - 1.80 |
2.3244 times |
Weekly price and charts GoldminingInc Strong weekly Stock price targets for GoldminingInc GLDG are 1.24 and 1.57 | Weekly Target 1 | 1.17 | | Weekly Target 2 | 1.3 | | Weekly Target 3 | 1.5033333333333 | | Weekly Target 4 | 1.63 | | Weekly Target 5 | 1.83 |
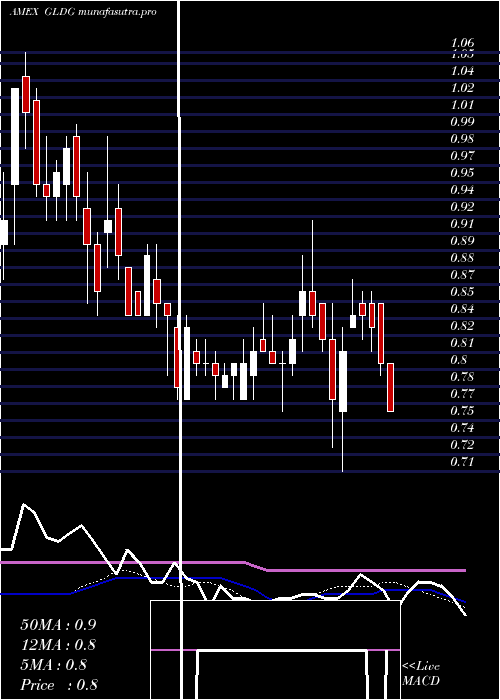
Weekly price and volumes for Goldmining Inc
| Date |
Closing |
Open |
Range |
Volume |
Thu 23 October 2025 |
1.42 (-7.19%) |
1.54 |
1.38 - 1.71 |
0.8541 times |
Fri 17 October 2025 |
1.53 (-10.53%) |
1.79 |
1.50 - 1.79 |
1.6851 times |
Fri 10 October 2025 |
1.71 (37.9%) |
1.30 |
1.24 - 1.80 |
3.0653 times |
Fri 03 October 2025 |
1.24 (2.48%) |
1.25 |
1.18 - 1.29 |
0.8406 times |
Fri 26 September 2025 |
1.21 (3.42%) |
1.22 |
1.14 - 1.30 |
0.6462 times |
Fri 19 September 2025 |
1.17 (-1.68%) |
1.19 |
1.12 - 1.30 |
0.6735 times |
Fri 12 September 2025 |
1.19 (8.18%) |
1.13 |
1.13 - 1.34 |
1.1239 times |
Fri 05 September 2025 |
1.10 (18.28%) |
0.93 |
0.93 - 1.11 |
0.6473 times |
Fri 29 August 2025 |
0.93 (0%) |
0.93 |
0.91 - 0.94 |
0.0566 times |
Fri 29 August 2025 |
0.93 (9.41%) |
0.85 |
0.84 - 0.94 |
0.4075 times |
Fri 22 August 2025 |
0.85 (4.94%) |
0.81 |
0.78 - 0.85 |
0.2283 times |
Monthly price and charts GoldminingInc Strong monthly Stock price targets for GoldminingInc GLDG are 1.3 and 1.92 | Monthly Target 1 | 0.85 | | Monthly Target 2 | 1.13 | | Monthly Target 3 | 1.4666666666667 | | Monthly Target 4 | 1.75 | | Monthly Target 5 | 2.09 |
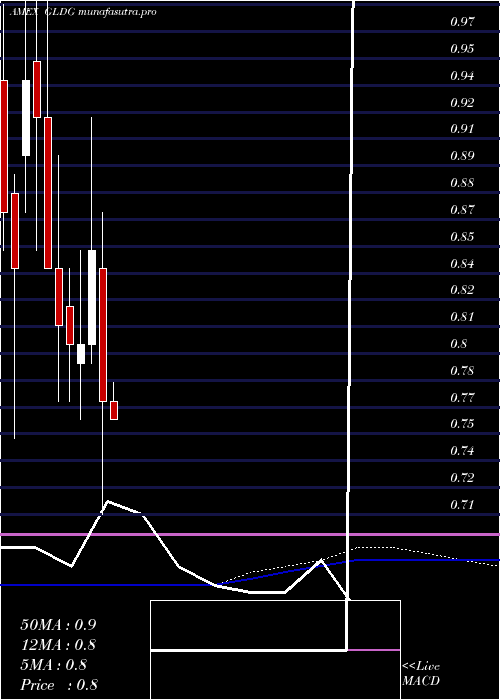
Monthly price and volumes Goldmining Inc
| Date |
Closing |
Open |
Range |
Volume |
Thu 23 October 2025 |
1.42 (15.45%) |
1.25 |
1.18 - 1.80 |
3.7891 times |
Tue 30 September 2025 |
1.23 (32.26%) |
0.93 |
0.93 - 1.34 |
2.148 times |
Fri 29 August 2025 |
0.93 (20.78%) |
0.77 |
0.77 - 0.94 |
0.679 times |
Thu 31 July 2025 |
0.77 (6.94%) |
0.73 |
0.72 - 0.84 |
0.5855 times |
Mon 30 June 2025 |
0.72 (-4%) |
0.76 |
0.72 - 0.79 |
0.5717 times |
Fri 30 May 2025 |
0.75 (-2.6%) |
0.77 |
0.75 - 0.83 |
0.4596 times |
Wed 30 April 2025 |
0.77 (-9.41%) |
0.84 |
0.71 - 0.87 |
0.5489 times |
Mon 31 March 2025 |
0.85 (6.25%) |
0.80 |
0.79 - 0.92 |
0.544 times |
Fri 28 February 2025 |
0.80 (0%) |
0.79 |
0.76 - 0.85 |
0.3318 times |
Fri 31 January 2025 |
0.80 (-1.23%) |
0.82 |
0.77 - 0.84 |
0.3424 times |
Tue 31 December 2024 |
0.81 (-3.57%) |
0.84 |
0.77 - 0.90 |
0.5112 times |
DMA SMA EMA moving averages of Goldmining Inc GLDG
DMA (daily moving average) of Goldmining Inc GLDG
| DMA period | DMA value | | 5 day DMA | 1.5 | | 12 day DMA | 1.61 | | 20 day DMA | 1.47 | | 35 day DMA | 1.35 | | 50 day DMA | 1.22 | | 100 day DMA | 0.99 | | 150 day DMA | 0.93 | | 200 day DMA | 0.9 | EMA (exponential moving average) of Goldmining Inc GLDG
| EMA period | EMA current | EMA prev | EMA prev2 | | 5 day EMA | 1.49 | 1.53 | 1.58 | | 12 day EMA | 1.52 | 1.54 | 1.56 | | 20 day EMA | 1.47 | 1.48 | 1.48 | | 35 day EMA | 1.34 | 1.34 | 1.33 | | 50 day EMA | 1.21 | 1.2 | 1.19 |
SMA (simple moving average) of Goldmining Inc GLDG
| SMA period | SMA current | SMA prev | SMA prev2 | | 5 day SMA | 1.5 | 1.55 | 1.61 | | 12 day SMA | 1.61 | 1.61 | 1.6 | | 20 day SMA | 1.47 | 1.45 | 1.44 | | 35 day SMA | 1.35 | 1.34 | 1.33 | | 50 day SMA | 1.22 | 1.2 | 1.19 | | 100 day SMA | 0.99 | 0.99 | 0.98 | | 150 day SMA | 0.93 | 0.92 | 0.92 | | 200 day SMA | 0.9 | 0.9 | 0.89 |
|
|
