SpdrGold GLD full analysis,charts,indicators,moving averages,SMA,DMA,EMA,ADX,MACD,RSISpdr Gold GLD WideScreen charts, DMA,SMA,EMA technical analysis, forecast prediction, by indicators ADX,MACD,RSI,CCI AMEX stock exchange
Daily price and charts and targets SpdrGold Strong Daily Stock price targets for SpdrGold GLD are 374.87 and 383.45 | Daily Target 1 | 368.26 | | Daily Target 2 | 372.9 | | Daily Target 3 | 376.83666666667 | | Daily Target 4 | 381.48 | | Daily Target 5 | 385.42 |
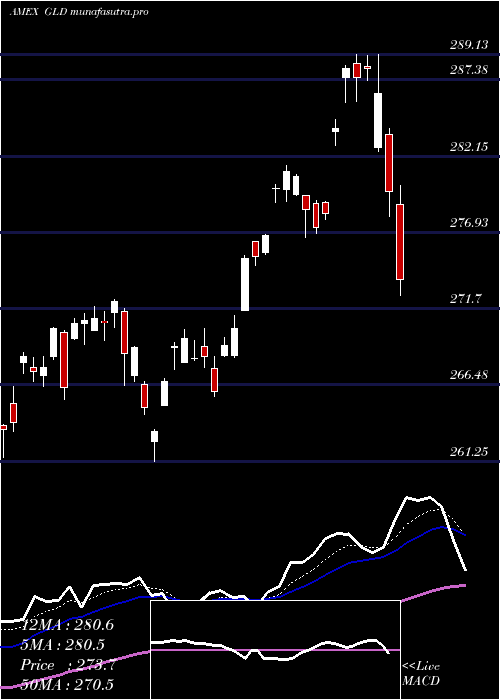
Daily price and volume Spdr Gold
| Date |
Closing |
Open |
Range |
Volume |
Fri 24 October 2025 |
377.55 (-0.33%) |
374.96 |
372.19 - 380.77 |
0.3414 times |
Thu 23 October 2025 |
378.80 (0.39%) |
376.95 |
375.47 - 382.25 |
0.3466 times |
Wed 22 October 2025 |
377.34 (0.03%) |
372.75 |
371.18 - 378.47 |
0.6953 times |
Tue 21 October 2025 |
377.24 (-6.39%) |
386.54 |
375.65 - 388.89 |
2.0326 times |
Mon 20 October 2025 |
402.97 (3.59%) |
391.61 |
388.75 - 403.30 |
0.8379 times |
Fri 17 October 2025 |
388.99 (-1.88%) |
397.14 |
385.22 - 397.28 |
2.3294 times |
Thu 16 October 2025 |
396.45 (2.34%) |
391.15 |
390.40 - 396.87 |
1.2567 times |
Wed 15 October 2025 |
387.39 (1.73%) |
385.93 |
384.59 - 387.76 |
0.7739 times |
Tue 14 October 2025 |
380.79 (0.71%) |
378.21 |
377.90 - 382.38 |
0.6917 times |
Mon 13 October 2025 |
378.09 (3.23%) |
376.50 |
375.58 - 378.86 |
0.6945 times |
Tue 07 October 2025 |
366.26 (0.52%) |
366.51 |
364.55 - 367.27 |
0.6326 times |
Weekly price and charts SpdrGold Strong weekly Stock price targets for SpdrGold GLD are 358.31 and 390.43 | Weekly Target 1 | 351.89 | | Weekly Target 2 | 364.72 | | Weekly Target 3 | 384.01 | | Weekly Target 4 | 396.84 | | Weekly Target 5 | 416.13 |
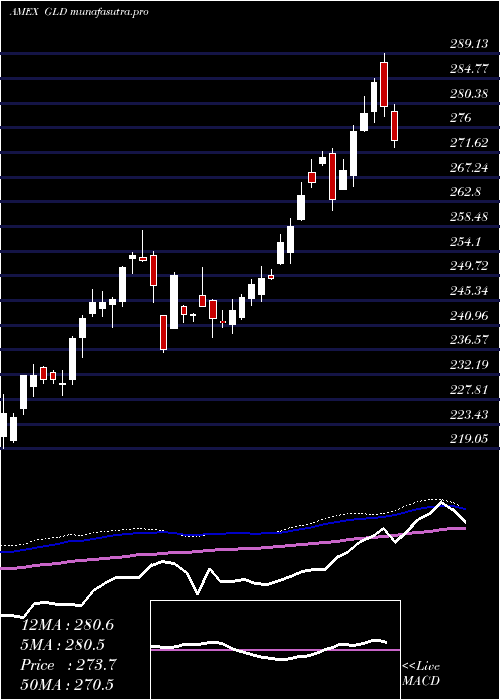
Weekly price and volumes for Spdr Gold
| Date |
Closing |
Open |
Range |
Volume |
Fri 24 October 2025 |
377.55 (-2.94%) |
391.61 |
371.18 - 403.30 |
1.627 times |
Fri 17 October 2025 |
388.99 (6.21%) |
376.50 |
375.58 - 397.28 |
2.1977 times |
Tue 07 October 2025 |
366.26 (2.41%) |
362.00 |
361.01 - 367.27 |
0.4191 times |
Fri 03 October 2025 |
357.64 (3.14%) |
351.79 |
350.87 - 358.67 |
0.9599 times |
Fri 26 September 2025 |
346.74 (2.23%) |
342.75 |
341.84 - 348.75 |
0.9738 times |
Fri 19 September 2025 |
339.18 (1.12%) |
336.31 |
333.81 - 341.24 |
0.9935 times |
Fri 12 September 2025 |
335.42 (1.32%) |
333.66 |
326.19 - 338.31 |
1.0185 times |
Fri 05 September 2025 |
331.05 (4.08%) |
320.82 |
320.24 - 331.44 |
0.9349 times |
Fri 29 August 2025 |
318.07 (0%) |
314.72 |
314.64 - 318.09 |
0.2247 times |
Fri 29 August 2025 |
318.07 (2.41%) |
309.67 |
309.67 - 318.09 |
0.6509 times |
Fri 22 August 2025 |
310.58 (1.02%) |
307.79 |
305.19 - 311.02 |
0.4457 times |
Monthly price and charts SpdrGold Strong monthly Stock price targets for SpdrGold GLD are 364.48 and 416.38 | Monthly Target 1 | 325.52 | | Monthly Target 2 | 351.53 | | Monthly Target 3 | 377.41666666667 | | Monthly Target 4 | 403.43 | | Monthly Target 5 | 429.32 |
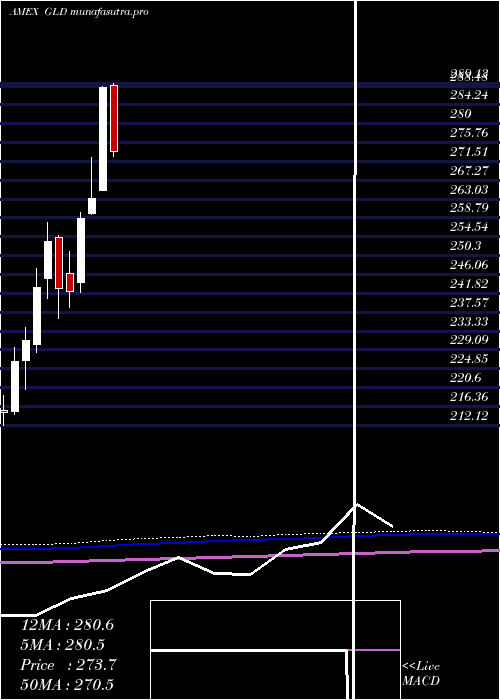
Monthly price and volumes Spdr Gold
| Date |
Closing |
Open |
Range |
Volume |
Fri 24 October 2025 |
377.55 (6.21%) |
356.17 |
351.40 - 403.30 |
1.4895 times |
Tue 30 September 2025 |
355.47 (11.76%) |
320.82 |
320.24 - 355.57 |
1.3497 times |
Fri 29 August 2025 |
318.07 (4.99%) |
308.61 |
305.19 - 318.09 |
0.8339 times |
Thu 31 July 2025 |
302.96 (-0.61%) |
308.55 |
300.96 - 316.24 |
0.9053 times |
Mon 30 June 2025 |
304.83 (0.41%) |
309.21 |
299.89 - 317.60 |
0.8326 times |
Fri 30 May 2025 |
303.60 (-0.06%) |
297.41 |
291.78 - 315.62 |
1.0405 times |
Wed 30 April 2025 |
303.77 (5.42%) |
288.54 |
272.58 - 317.63 |
1.3069 times |
Mon 31 March 2025 |
288.14 (9.45%) |
265.07 |
265.07 - 288.39 |
0.7465 times |
Fri 28 February 2025 |
263.27 (1.82%) |
259.75 |
259.52 - 272.32 |
0.8003 times |
Fri 31 January 2025 |
258.56 (6.79%) |
244.22 |
242.05 - 259.99 |
0.6949 times |
Tue 31 December 2024 |
242.13 (-0.34%) |
246.28 |
238.73 - 251.26 |
0.4026 times |
DMA SMA EMA moving averages of Spdr Gold GLD
DMA (daily moving average) of Spdr Gold GLD
| DMA period | DMA value | | 5 day DMA | 382.78 | | 12 day DMA | 381.35 | | 20 day DMA | 369.37 | | 35 day DMA | 355.13 | | 50 day DMA | 342.06 | | 100 day DMA | 325.22 | | 150 day DMA | 316.02 | | 200 day DMA | 302.53 | EMA (exponential moving average) of Spdr Gold GLD
| EMA period | EMA current | EMA prev | EMA prev2 | | 5 day EMA | 380.44 | 381.89 | 383.43 | | 12 day EMA | 377.62 | 377.63 | 377.42 | | 20 day EMA | 370.41 | 369.66 | 368.7 | | 35 day EMA | 357.26 | 356.07 | 354.73 | | 50 day EMA | 343.47 | 342.08 | 340.58 |
SMA (simple moving average) of Spdr Gold GLD
| SMA period | SMA current | SMA prev | SMA prev2 | | 5 day SMA | 382.78 | 385.07 | 388.6 | | 12 day SMA | 381.35 | 379.7 | 377.69 | | 20 day SMA | 369.37 | 367.82 | 366.13 | | 35 day SMA | 355.13 | 353.64 | 351.91 | | 50 day SMA | 342.06 | 340.68 | 339.27 | | 100 day SMA | 325.22 | 324.48 | 323.74 | | 150 day SMA | 316.02 | 315.37 | 314.69 | | 200 day SMA | 302.53 | 301.85 | 301.18 |
|
|
