GsAccess GIGB full analysis,charts,indicators,moving averages,SMA,DMA,EMA,ADX,MACD,RSIGs Access GIGB WideScreen charts, DMA,SMA,EMA technical analysis, forecast prediction, by indicators ADX,MACD,RSI,CCI AMEX stock exchange
Daily price and charts and targets GsAccess Strong Daily Stock price targets for GsAccess GIGB are 47.04 and 47.1 | Daily Target 1 | 47.02 | | Daily Target 2 | 47.06 | | Daily Target 3 | 47.083333333333 | | Daily Target 4 | 47.12 | | Daily Target 5 | 47.14 |
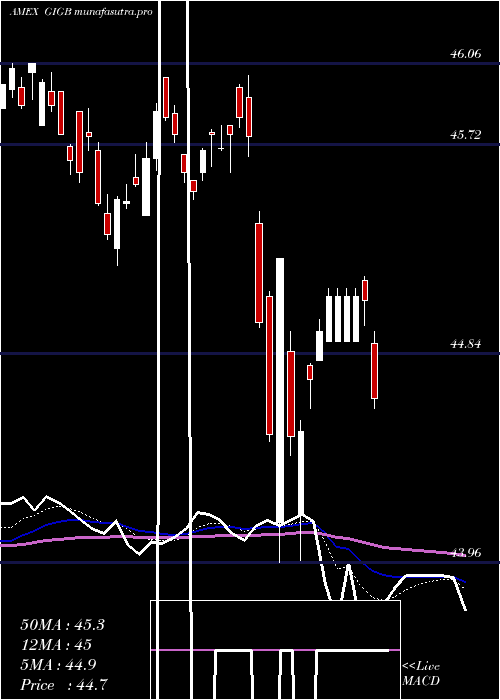
Daily price and volume Gs Access
| Date |
Closing |
Open |
Range |
Volume |
Fri 24 October 2025 |
47.09 (0.11%) |
47.11 |
47.05 - 47.11 |
1.2247 times |
Thu 23 October 2025 |
47.04 (-0.08%) |
47.04 |
47.02 - 47.08 |
1.0077 times |
Wed 22 October 2025 |
47.08 (0.04%) |
47.05 |
46.99 - 47.08 |
0.4491 times |
Tue 21 October 2025 |
47.06 (0.04%) |
47.09 |
47.05 - 47.13 |
0.7878 times |
Mon 20 October 2025 |
47.04 (0.19%) |
46.98 |
46.98 - 47.04 |
0.3361 times |
Fri 17 October 2025 |
46.95 (-0.06%) |
46.93 |
46.89 - 46.97 |
1.1697 times |
Thu 16 October 2025 |
46.98 (0.28%) |
46.87 |
46.84 - 46.99 |
1.4484 times |
Wed 15 October 2025 |
46.85 (-0.04%) |
46.93 |
46.80 - 47.00 |
1.7054 times |
Tue 14 October 2025 |
46.87 (0.28%) |
46.67 |
46.65 - 46.89 |
0.7662 times |
Mon 13 October 2025 |
46.74 (0.28%) |
46.60 |
46.49 - 46.77 |
1.1049 times |
Tue 07 October 2025 |
46.61 (0.15%) |
46.62 |
46.55 - 46.64 |
1.028 times |
Weekly price and charts GsAccess Strong weekly Stock price targets for GsAccess GIGB are 47.04 and 47.19 | Weekly Target 1 | 46.92 | | Weekly Target 2 | 47 | | Weekly Target 3 | 47.066666666667 | | Weekly Target 4 | 47.15 | | Weekly Target 5 | 47.22 |
Weekly price and volumes for Gs Access
| Date |
Closing |
Open |
Range |
Volume |
Fri 24 October 2025 |
47.09 (0.3%) |
46.98 |
46.98 - 47.13 |
0.6185 times |
Fri 17 October 2025 |
46.95 (0.73%) |
46.60 |
46.49 - 47.00 |
1.0068 times |
Tue 07 October 2025 |
46.61 (-0.11%) |
46.54 |
46.54 - 46.64 |
0.2533 times |
Fri 03 October 2025 |
46.66 (0.21%) |
46.68 |
46.54 - 46.81 |
1.1278 times |
Fri 26 September 2025 |
46.56 (-0.43%) |
46.75 |
46.41 - 46.76 |
0.657 times |
Fri 19 September 2025 |
46.76 (-0.17%) |
46.90 |
46.71 - 47.02 |
1.1462 times |
Fri 12 September 2025 |
46.84 (0.64%) |
46.70 |
46.54 - 46.95 |
1.3984 times |
Fri 05 September 2025 |
46.54 (0.89%) |
46.00 |
45.75 - 46.60 |
1.8645 times |
Fri 29 August 2025 |
46.13 (0%) |
46.21 |
46.11 - 46.21 |
0.1733 times |
Fri 29 August 2025 |
46.13 (-0.24%) |
46.18 |
46.05 - 46.28 |
1.7541 times |
Fri 22 August 2025 |
46.24 (0.39%) |
46.09 |
45.89 - 46.28 |
1.0994 times |

Monthly price and charts GsAccess Strong monthly Stock price targets for GsAccess GIGB are 46.79 and 47.43 | Monthly Target 1 | 46.26 | | Monthly Target 2 | 46.68 | | Monthly Target 3 | 46.903333333333 | | Monthly Target 4 | 47.32 | | Monthly Target 5 | 47.54 |
Monthly price and volumes Gs Access
| Date |
Closing |
Open |
Range |
Volume |
Fri 24 October 2025 |
47.09 (0.86%) |
46.63 |
46.49 - 47.13 |
0.4486 times |
Tue 30 September 2025 |
46.69 (1.21%) |
46.00 |
45.75 - 47.02 |
0.9228 times |
Fri 29 August 2025 |
46.13 (0.59%) |
45.85 |
45.85 - 46.28 |
0.817 times |
Thu 31 July 2025 |
45.86 (-0.35%) |
45.86 |
45.28 - 45.97 |
0.8816 times |
Mon 30 June 2025 |
46.02 (1.37%) |
45.13 |
45.02 - 46.05 |
0.7714 times |
Fri 30 May 2025 |
45.40 (-0.11%) |
45.32 |
44.66 - 45.40 |
0.716 times |
Wed 30 April 2025 |
45.45 (-0.68%) |
45.70 |
43.96 - 46.01 |
3.0456 times |
Mon 31 March 2025 |
45.76 (-0.65%) |
45.80 |
45.21 - 46.02 |
1.0237 times |
Fri 28 February 2025 |
46.06 (1.63%) |
45.14 |
44.93 - 46.06 |
0.7556 times |
Fri 31 January 2025 |
45.32 (0.55%) |
45.17 |
44.44 - 45.52 |
0.6178 times |
Tue 31 December 2024 |
45.07 (-2.15%) |
46.36 |
45.04 - 46.37 |
0.6645 times |

DMA SMA EMA moving averages of Gs Access GIGB
DMA (daily moving average) of Gs Access GIGB
| DMA period | DMA value | | 5 day DMA | 47.06 | | 12 day DMA | 46.9 | | 20 day DMA | 46.8 | | 35 day DMA | 46.75 | | 50 day DMA | 46.56 | | 100 day DMA | 46.1 | | 150 day DMA | 45.8 | | 200 day DMA | 45.69 | EMA (exponential moving average) of Gs Access GIGB
| EMA period | EMA current | EMA prev | EMA prev2 | | 5 day EMA | 47.04 | 47.02 | 47.01 | | 12 day EMA | 46.94 | 46.91 | 46.89 | | 20 day EMA | 46.85 | 46.82 | 46.8 | | 35 day EMA | 46.7 | 46.68 | 46.66 | | 50 day EMA | 46.56 | 46.54 | 46.52 |
SMA (simple moving average) of Gs Access GIGB
| SMA period | SMA current | SMA prev | SMA prev2 | | 5 day SMA | 47.06 | 47.03 | 47.02 | | 12 day SMA | 46.9 | 46.87 | 46.84 | | 20 day SMA | 46.8 | 46.78 | 46.76 | | 35 day SMA | 46.75 | 46.72 | 46.69 | | 50 day SMA | 46.56 | 46.54 | 46.52 | | 100 day SMA | 46.1 | 46.08 | 46.06 | | 150 day SMA | 45.8 | 45.79 | 45.78 | | 200 day SMA | 45.69 | 45.68 | 45.67 |
|
|
