GamcoGlobal GGN-B full analysis,charts,indicators,moving averages,SMA,DMA,EMA,ADX,MACD,RSIGamco Global GGN-B WideScreen charts, DMA,SMA,EMA technical analysis, forecast prediction, by indicators ADX,MACD,RSI,CCI AMEX stock exchange
Daily price and charts and targets GamcoGlobal Strong Daily Stock price targets for GamcoGlobal GGN-B are 20.99 and 21.09 | Daily Target 1 | 20.91 | | Daily Target 2 | 20.97 | | Daily Target 3 | 21.01 | | Daily Target 4 | 21.07 | | Daily Target 5 | 21.11 |
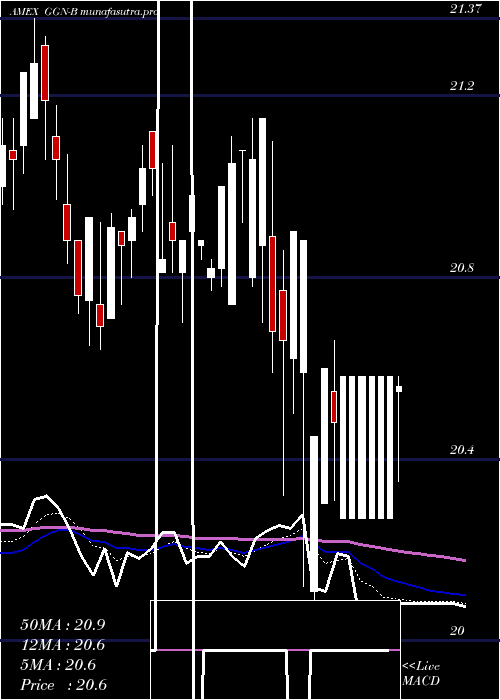
Daily price and volume Gamco Global
| Date |
Closing |
Open |
Range |
Volume |
Thu 23 October 2025 |
21.03 (0.1%) |
21.01 |
20.95 - 21.05 |
1.1198 times |
Wed 22 October 2025 |
21.01 (0.1%) |
20.95 |
20.90 - 21.04 |
0.8594 times |
Tue 21 October 2025 |
20.99 (0.38%) |
20.95 |
20.91 - 21.01 |
1.1979 times |
Mon 20 October 2025 |
20.91 (0.34%) |
20.82 |
20.80 - 20.91 |
1.4063 times |
Fri 17 October 2025 |
20.84 (0.1%) |
20.84 |
20.80 - 21.00 |
0.599 times |
Thu 16 October 2025 |
20.82 (-0.19%) |
20.75 |
20.75 - 20.82 |
0.2865 times |
Wed 15 October 2025 |
20.86 (0.14%) |
20.88 |
20.71 - 20.88 |
1.0677 times |
Tue 14 October 2025 |
20.83 (-0.43%) |
20.90 |
20.68 - 20.90 |
1.0417 times |
Mon 13 October 2025 |
20.92 (1.01%) |
20.93 |
20.54 - 21.08 |
0.7292 times |
Fri 10 October 2025 |
20.71 (-0.67%) |
20.99 |
20.54 - 21.00 |
1.6927 times |
Thu 09 October 2025 |
20.85 (0.05%) |
20.72 |
20.65 - 20.85 |
2.8906 times |
Weekly price and charts GamcoGlobal Strong weekly Stock price targets for GamcoGlobal GGN-B are 20.92 and 21.17 | Weekly Target 1 | 20.71 | | Weekly Target 2 | 20.87 | | Weekly Target 3 | 20.96 | | Weekly Target 4 | 21.12 | | Weekly Target 5 | 21.21 |
Weekly price and volumes for Gamco Global
| Date |
Closing |
Open |
Range |
Volume |
Thu 23 October 2025 |
21.03 (0.91%) |
20.82 |
20.80 - 21.05 |
0.7114 times |
Fri 17 October 2025 |
20.84 (0.63%) |
20.93 |
20.54 - 21.08 |
0.578 times |
Fri 10 October 2025 |
20.71 (-1.76%) |
20.97 |
20.54 - 21.00 |
1.5117 times |
Fri 03 October 2025 |
21.08 (-0.47%) |
21.06 |
20.69 - 21.22 |
1.3581 times |
Fri 26 September 2025 |
21.18 (-0.42%) |
21.16 |
20.79 - 21.35 |
0.8771 times |
Fri 19 September 2025 |
21.27 (-0.61%) |
21.50 |
21.15 - 21.65 |
1.1722 times |
Fri 12 September 2025 |
21.40 (1.42%) |
21.01 |
21.01 - 21.87 |
1.5885 times |
Fri 05 September 2025 |
21.10 (1.44%) |
20.79 |
20.68 - 21.12 |
1.0873 times |
Fri 29 August 2025 |
20.80 (0%) |
20.72 |
20.69 - 20.89 |
0.19 times |
Fri 29 August 2025 |
20.80 (-1.09%) |
20.80 |
20.60 - 20.96 |
0.9256 times |
Fri 22 August 2025 |
21.03 (1.35%) |
20.65 |
20.60 - 21.09 |
1.2369 times |
Monthly price and charts GamcoGlobal Strong monthly Stock price targets for GamcoGlobal GGN-B are 20.79 and 21.33 | Monthly Target 1 | 20.34 | | Monthly Target 2 | 20.69 | | Monthly Target 3 | 20.883333333333 | | Monthly Target 4 | 21.23 | | Monthly Target 5 | 21.42 |
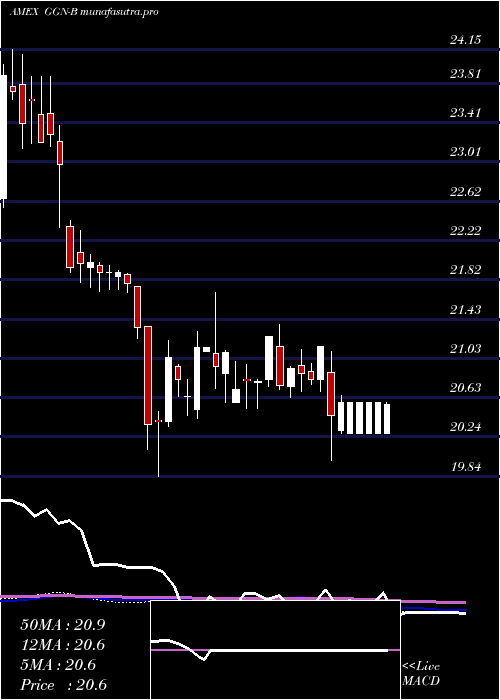
Monthly price and volumes Gamco Global
| Date |
Closing |
Open |
Range |
Volume |
Thu 23 October 2025 |
21.03 (1.01%) |
20.82 |
20.54 - 21.08 |
0.5734 times |
Tue 30 September 2025 |
20.82 (0.1%) |
20.79 |
20.68 - 21.87 |
0.7965 times |
Fri 29 August 2025 |
20.80 (1.36%) |
20.47 |
20.47 - 21.09 |
0.5641 times |
Thu 31 July 2025 |
20.52 (0.59%) |
20.36 |
20.25 - 20.80 |
0.6587 times |
Mon 30 June 2025 |
20.40 (-0.2%) |
20.44 |
20.21 - 20.64 |
0.4737 times |
Fri 30 May 2025 |
20.44 (-1.02%) |
20.66 |
20.30 - 21.66 |
0.8102 times |
Wed 30 April 2025 |
20.65 (-1.67%) |
20.74 |
20.00 - 21.15 |
1.2187 times |
Mon 31 March 2025 |
21.00 (-1.18%) |
21.15 |
20.64 - 21.37 |
1.7832 times |
Fri 28 February 2025 |
21.25 (0.76%) |
20.59 |
20.52 - 21.25 |
2.4395 times |
Fri 31 January 2025 |
21.09 (1.88%) |
20.71 |
20.42 - 21.70 |
0.6821 times |
Tue 31 December 2024 |
20.70 (-5.48%) |
21.88 |
19.84 - 21.89 |
1.9042 times |

DMA SMA EMA moving averages of Gamco Global GGN-B
DMA (daily moving average) of Gamco Global GGN-B
| DMA period | DMA value | | 5 day DMA | 20.96 | | 12 day DMA | 20.88 | | 20 day DMA | 20.92 | | 35 day DMA | 21.12 | | 50 day DMA | 21.03 | | 100 day DMA | 20.78 | | 150 day DMA | 20.75 | | 200 day DMA | 20.79 | EMA (exponential moving average) of Gamco Global GGN-B
| EMA period | EMA current | EMA prev | EMA prev2 | | 5 day EMA | 20.97 | 20.94 | 20.9 | | 12 day EMA | 20.95 | 20.93 | 20.91 | | 20 day EMA | 20.96 | 20.95 | 20.94 | | 35 day EMA | 20.94 | 20.93 | 20.93 | | 50 day EMA | 20.99 | 20.99 | 20.99 |
SMA (simple moving average) of Gamco Global GGN-B
| SMA period | SMA current | SMA prev | SMA prev2 | | 5 day SMA | 20.96 | 20.91 | 20.88 | | 12 day SMA | 20.88 | 20.86 | 20.85 | | 20 day SMA | 20.92 | 20.94 | 20.95 | | 35 day SMA | 21.12 | 21.12 | 21.11 | | 50 day SMA | 21.03 | 21.03 | 21.02 | | 100 day SMA | 20.78 | 20.77 | 20.77 | | 150 day SMA | 20.75 | 20.75 | 20.75 | | 200 day SMA | 20.79 | 20.79 | 20.79 |
|
|
