GamcoGlobal GGN full analysis,charts,indicators,moving averages,SMA,DMA,EMA,ADX,MACD,RSIGamco Global GGN WideScreen charts, DMA,SMA,EMA technical analysis, forecast prediction, by indicators ADX,MACD,RSI,CCI AMEX stock exchange
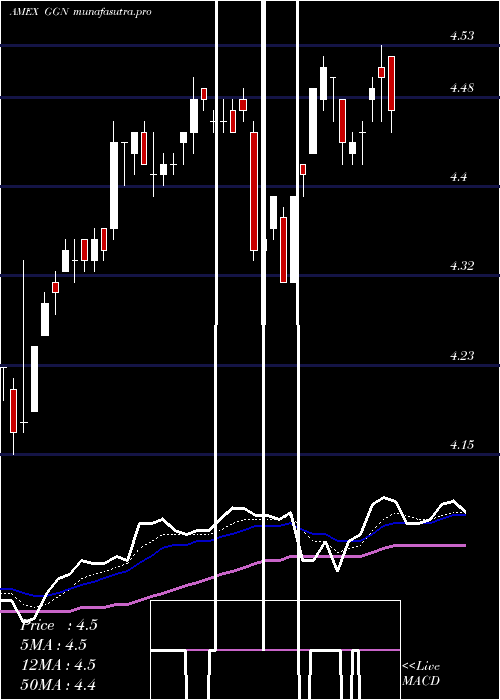
Daily price and charts and targets GamcoGlobal Strong Daily Stock price targets for GamcoGlobal GGN are 4.92 and 4.99 | Daily Target 1 | 4.86 | | Daily Target 2 | 4.9 | | Daily Target 3 | 4.93 | | Daily Target 4 | 4.97 | | Daily Target 5 | 5 |
Daily price and volume Gamco Global
| Date |
Closing |
Open |
Range |
Volume |
Thu 23 October 2025 |
4.94 (1.65%) |
4.89 |
4.89 - 4.96 |
0.8051 times |
Wed 22 October 2025 |
4.86 (2.32%) |
4.75 |
4.70 - 4.86 |
1.1066 times |
Tue 21 October 2025 |
4.75 (-6.13%) |
4.99 |
4.75 - 5.00 |
2.3646 times |
Mon 20 October 2025 |
5.06 (-0.78%) |
5.13 |
5.05 - 5.13 |
0.8765 times |
Fri 17 October 2025 |
5.10 (-1.73%) |
5.19 |
5.05 - 5.20 |
0.7483 times |
Thu 16 October 2025 |
5.19 (-1.14%) |
5.26 |
5.16 - 5.31 |
0.9351 times |
Wed 15 October 2025 |
5.25 (2.14%) |
5.18 |
5.17 - 5.25 |
0.5288 times |
Tue 14 October 2025 |
5.14 (-0.96%) |
5.17 |
5.13 - 5.18 |
0.5343 times |
Mon 13 October 2025 |
5.19 (2.17%) |
5.13 |
5.12 - 5.22 |
0.6846 times |
Fri 10 October 2025 |
5.08 (-2.31%) |
5.22 |
5.06 - 5.22 |
1.4162 times |
Thu 09 October 2025 |
5.20 (-0.95%) |
5.28 |
5.17 - 5.29 |
0.6948 times |
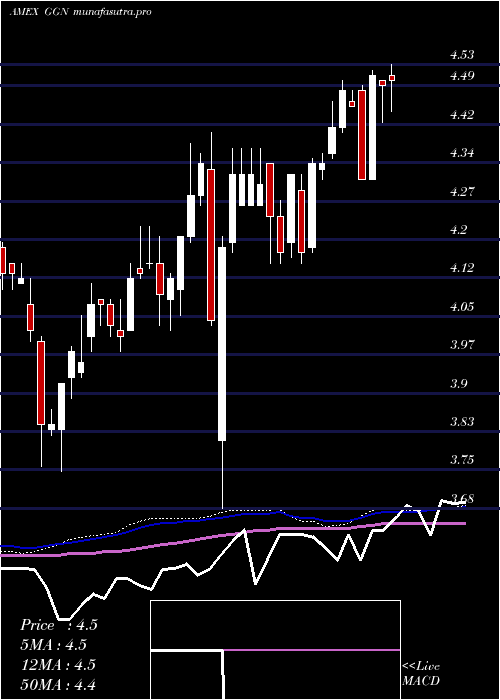
Weekly price and charts GamcoGlobal Strong weekly Stock price targets for GamcoGlobal GGN are 4.61 and 5.04 | Weekly Target 1 | 4.49 | | Weekly Target 2 | 4.72 | | Weekly Target 3 | 4.9233333333333 | | Weekly Target 4 | 5.15 | | Weekly Target 5 | 5.35 |
Weekly price and volumes for Gamco Global
| Date |
Closing |
Open |
Range |
Volume |
Thu 23 October 2025 |
4.94 (-3.14%) |
5.13 |
4.70 - 5.13 |
1.7412 times |
Fri 17 October 2025 |
5.10 (0.39%) |
5.13 |
5.05 - 5.31 |
1.1594 times |
Fri 10 October 2025 |
5.08 (-2.12%) |
5.19 |
5.05 - 5.29 |
1.2501 times |
Fri 03 October 2025 |
5.19 (1.17%) |
5.17 |
5.11 - 5.21 |
0.8406 times |
Fri 26 September 2025 |
5.13 (2.81%) |
5.02 |
5.00 - 5.18 |
1.1188 times |
Fri 19 September 2025 |
4.99 (0%) |
5.00 |
4.93 - 5.04 |
0.8055 times |
Fri 12 September 2025 |
4.99 (3.74%) |
4.84 |
4.82 - 5.00 |
1.02 times |
Fri 05 September 2025 |
4.81 (1.69%) |
4.74 |
4.73 - 4.85 |
0.9771 times |
Fri 29 August 2025 |
4.73 (0%) |
4.70 |
4.70 - 4.73 |
0.1651 times |
Fri 29 August 2025 |
4.73 (1.94%) |
4.65 |
4.62 - 4.74 |
0.9223 times |
Fri 22 August 2025 |
4.64 (1.75%) |
4.55 |
4.43 - 4.65 |
0.8399 times |
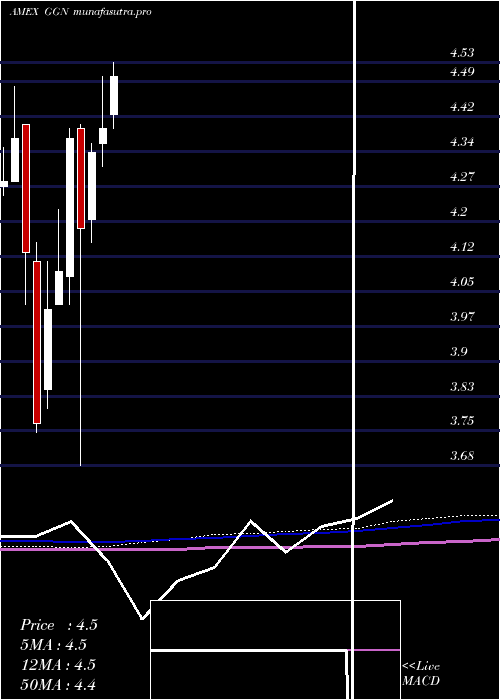
Monthly price and charts GamcoGlobal Strong monthly Stock price targets for GamcoGlobal GGN are 4.52 and 5.13 | Monthly Target 1 | 4.37 | | Monthly Target 2 | 4.66 | | Monthly Target 3 | 4.9833333333333 | | Monthly Target 4 | 5.27 | | Monthly Target 5 | 5.59 |
Monthly price and volumes Gamco Global
| Date |
Closing |
Open |
Range |
Volume |
Thu 23 October 2025 |
4.94 (-4.26%) |
5.15 |
4.70 - 5.31 |
1.0844 times |
Tue 30 September 2025 |
5.16 (9.09%) |
4.74 |
4.73 - 5.18 |
0.9915 times |
Fri 29 August 2025 |
4.73 (6.53%) |
4.47 |
4.41 - 4.74 |
0.716 times |
Thu 31 July 2025 |
4.44 (1.14%) |
4.42 |
4.36 - 4.53 |
0.8825 times |
Mon 30 June 2025 |
4.39 (1.15%) |
4.36 |
4.31 - 4.50 |
0.9076 times |
Fri 30 May 2025 |
4.34 (3.83%) |
4.20 |
4.15 - 4.36 |
1.1101 times |
Wed 30 April 2025 |
4.18 (-4.35%) |
4.39 |
3.68 - 4.40 |
1.6301 times |
Mon 31 March 2025 |
4.37 (6.85%) |
4.08 |
4.02 - 4.39 |
0.9775 times |
Fri 28 February 2025 |
4.09 (2%) |
4.02 |
4.02 - 4.22 |
0.7692 times |
Fri 31 January 2025 |
4.01 (6.37%) |
3.84 |
3.80 - 4.11 |
0.931 times |
Tue 31 December 2024 |
3.77 (-8.72%) |
4.11 |
3.75 - 4.15 |
1.0624 times |
DMA SMA EMA moving averages of Gamco Global GGN
DMA (daily moving average) of Gamco Global GGN
| DMA period | DMA value | | 5 day DMA | 4.94 | | 12 day DMA | 5.08 | | 20 day DMA | 5.12 | | 35 day DMA | 5.06 | | 50 day DMA | 4.94 | | 100 day DMA | 4.7 | | 150 day DMA | 4.55 | | 200 day DMA | 4.44 | EMA (exponential moving average) of Gamco Global GGN
| EMA period | EMA current | EMA prev | EMA prev2 | | 5 day EMA | 4.95 | 4.95 | 5 | | 12 day EMA | 5.03 | 5.05 | 5.08 | | 20 day EMA | 5.06 | 5.07 | 5.09 | | 35 day EMA | 4.99 | 4.99 | 5 | | 50 day EMA | 4.92 | 4.92 | 4.92 |
SMA (simple moving average) of Gamco Global GGN
| SMA period | SMA current | SMA prev | SMA prev2 | | 5 day SMA | 4.94 | 4.99 | 5.07 | | 12 day SMA | 5.08 | 5.11 | 5.13 | | 20 day SMA | 5.12 | 5.13 | 5.14 | | 35 day SMA | 5.06 | 5.06 | 5.05 | | 50 day SMA | 4.94 | 4.94 | 4.93 | | 100 day SMA | 4.7 | 4.7 | 4.69 | | 150 day SMA | 4.55 | 4.55 | 4.54 | | 200 day SMA | 4.44 | 4.44 | 4.43 |
|
|
