GoldmanSachs GEM full analysis,charts,indicators,moving averages,SMA,DMA,EMA,ADX,MACD,RSIGoldman Sachs GEM WideScreen charts, DMA,SMA,EMA technical analysis, forecast prediction, by indicators ADX,MACD,RSI,CCI AMEX stock exchange
Daily price and charts and targets GoldmanSachs Strong Daily Stock price targets for GoldmanSachs GEM are 41.77 and 42.02 | Daily Target 1 | 41.57 | | Daily Target 2 | 41.71 | | Daily Target 3 | 41.816666666667 | | Daily Target 4 | 41.96 | | Daily Target 5 | 42.07 |
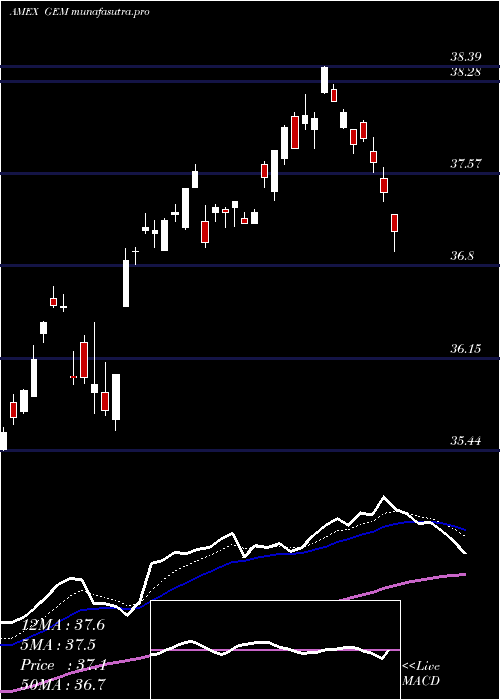
Daily price and volume Goldman Sachs
| Date |
Closing |
Open |
Range |
Volume |
Thu 23 October 2025 |
41.86 (0.72%) |
41.69 |
41.67 - 41.92 |
0.588 times |
Wed 22 October 2025 |
41.56 (0.07%) |
41.68 |
41.31 - 41.81 |
0.8828 times |
Tue 21 October 2025 |
41.53 (-0.93%) |
41.65 |
41.48 - 41.65 |
1.4586 times |
Mon 20 October 2025 |
41.92 (1.21%) |
41.64 |
41.64 - 42.01 |
0.8593 times |
Fri 17 October 2025 |
41.42 (-0.1%) |
41.07 |
41.06 - 41.43 |
0.8255 times |
Thu 16 October 2025 |
41.46 (0.46%) |
41.49 |
41.29 - 41.65 |
0.7485 times |
Wed 15 October 2025 |
41.27 (2.03%) |
41.16 |
40.96 - 41.32 |
0.9506 times |
Tue 14 October 2025 |
40.45 (-1.05%) |
40.22 |
40.13 - 40.74 |
0.7639 times |
Mon 13 October 2025 |
40.88 (2.92%) |
40.77 |
40.65 - 40.97 |
1.0029 times |
Fri 10 October 2025 |
39.72 (-3.48%) |
41.16 |
39.64 - 41.24 |
1.9199 times |
Thu 09 October 2025 |
41.15 (-0.72%) |
41.51 |
41.02 - 41.51 |
0.7396 times |
Weekly price and charts GoldmanSachs Strong weekly Stock price targets for GoldmanSachs GEM are 41.59 and 42.29 | Weekly Target 1 | 41.03 | | Weekly Target 2 | 41.44 | | Weekly Target 3 | 41.726666666667 | | Weekly Target 4 | 42.14 | | Weekly Target 5 | 42.43 |
Weekly price and volumes for Goldman Sachs
| Date |
Closing |
Open |
Range |
Volume |
Thu 23 October 2025 |
41.86 (1.06%) |
41.64 |
41.31 - 42.01 |
0.7843 times |
Fri 17 October 2025 |
41.42 (4.28%) |
40.77 |
40.13 - 41.65 |
0.8884 times |
Fri 10 October 2025 |
39.72 (-3.97%) |
41.36 |
39.64 - 41.62 |
1.4272 times |
Fri 03 October 2025 |
41.36 (2.71%) |
40.65 |
40.55 - 41.44 |
1.0033 times |
Fri 26 September 2025 |
40.27 (-0.89%) |
40.64 |
40.01 - 40.95 |
1.5694 times |
Fri 19 September 2025 |
40.63 (1.04%) |
40.39 |
40.35 - 41.10 |
0.9334 times |
Fri 12 September 2025 |
40.21 (3.47%) |
39.08 |
39.01 - 40.29 |
1.1275 times |
Fri 05 September 2025 |
38.86 (0.99%) |
38.10 |
38.10 - 39.02 |
0.9102 times |
Fri 29 August 2025 |
38.48 (0%) |
38.48 |
38.39 - 38.53 |
0.2092 times |
Fri 29 August 2025 |
38.48 (-1.38%) |
38.96 |
38.28 - 39.07 |
1.1472 times |
Fri 22 August 2025 |
39.02 (1.32%) |
38.65 |
38.20 - 39.06 |
2.7986 times |

Monthly price and charts GoldmanSachs Strong monthly Stock price targets for GoldmanSachs GEM are 40.75 and 43.12 | Monthly Target 1 | 38.8 | | Monthly Target 2 | 40.33 | | Monthly Target 3 | 41.17 | | Monthly Target 4 | 42.7 | | Monthly Target 5 | 43.54 |
Monthly price and volumes Goldman Sachs
| Date |
Closing |
Open |
Range |
Volume |
Thu 23 October 2025 |
41.86 (2.77%) |
40.87 |
39.64 - 42.01 |
0.4104 times |
Tue 30 September 2025 |
40.73 (5.85%) |
38.10 |
38.10 - 41.10 |
0.5385 times |
Fri 29 August 2025 |
38.48 (2.83%) |
37.25 |
36.97 - 39.07 |
0.7154 times |
Thu 31 July 2025 |
37.42 (0.56%) |
37.25 |
37.00 - 38.39 |
0.7444 times |
Mon 30 June 2025 |
37.21 (6.93%) |
34.93 |
34.72 - 37.26 |
0.8157 times |
Fri 30 May 2025 |
34.80 (4.29%) |
33.45 |
33.27 - 35.66 |
0.8387 times |
Wed 30 April 2025 |
33.37 (0.57%) |
33.19 |
29.19 - 33.50 |
1.2193 times |
Mon 31 March 2025 |
33.18 (1.72%) |
32.85 |
32.24 - 34.37 |
1.3981 times |
Fri 28 February 2025 |
32.62 (0.49%) |
32.01 |
31.97 - 34.27 |
0.6198 times |
Fri 31 January 2025 |
32.46 (1.69%) |
31.93 |
30.95 - 32.94 |
2.6997 times |
Tue 31 December 2024 |
31.92 (-3.42%) |
33.20 |
31.84 - 34.55 |
0.6913 times |

DMA SMA EMA moving averages of Goldman Sachs GEM
DMA (daily moving average) of Goldman Sachs GEM
| DMA period | DMA value | | 5 day DMA | 41.66 | | 12 day DMA | 41.22 | | 20 day DMA | 41.13 | | 35 day DMA | 40.75 | | 50 day DMA | 40.09 | | 100 day DMA | 38.63 | | 150 day DMA | 36.85 | | 200 day DMA | 35.87 | EMA (exponential moving average) of Goldman Sachs GEM
| EMA period | EMA current | EMA prev | EMA prev2 | | 5 day EMA | 41.61 | 41.49 | 41.46 | | 12 day EMA | 41.35 | 41.26 | 41.21 | | 20 day EMA | 41.12 | 41.04 | 40.98 | | 35 day EMA | 40.6 | 40.53 | 40.47 | | 50 day EMA | 40.1 | 40.03 | 39.97 |
SMA (simple moving average) of Goldman Sachs GEM
| SMA period | SMA current | SMA prev | SMA prev2 | | 5 day SMA | 41.66 | 41.58 | 41.52 | | 12 day SMA | 41.22 | 41.17 | 41.16 | | 20 day SMA | 41.13 | 41.06 | 41.01 | | 35 day SMA | 40.75 | 40.65 | 40.56 | | 50 day SMA | 40.09 | 40.03 | 39.97 | | 100 day SMA | 38.63 | 38.56 | 38.5 | | 150 day SMA | 36.85 | 36.8 | 36.75 | | 200 day SMA | 35.87 | 35.82 | 35.77 |
|
|
