JuniorGold GDXJ full analysis,charts,indicators,moving averages,SMA,DMA,EMA,ADX,MACD,RSIJunior Gold GDXJ WideScreen charts, DMA,SMA,EMA technical analysis, forecast prediction, by indicators ADX,MACD,RSI,CCI AMEX stock exchange
Daily price and charts and targets JuniorGold Strong Daily Stock price targets for JuniorGold GDXJ are 93.97 and 97.56 | Daily Target 1 | 91.28 | | Daily Target 2 | 93.07 | | Daily Target 3 | 94.866666666667 | | Daily Target 4 | 96.66 | | Daily Target 5 | 98.46 |
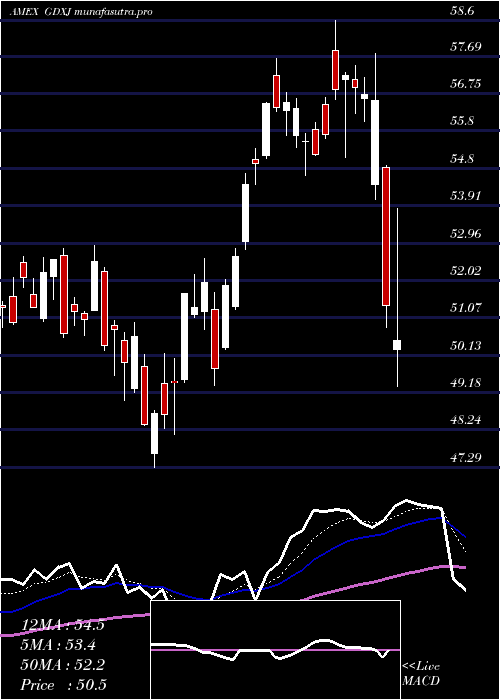
Daily price and volume Junior Gold
| Date |
Closing |
Open |
Range |
Volume |
Fri 24 October 2025 |
94.87 (-1.23%) |
93.88 |
93.07 - 96.66 |
0.4878 times |
Thu 23 October 2025 |
96.05 (0.96%) |
96.30 |
94.68 - 97.76 |
0.6939 times |
Wed 22 October 2025 |
95.14 (0.03%) |
96.12 |
91.01 - 96.67 |
1.1506 times |
Tue 21 October 2025 |
95.11 (-10.36%) |
97.90 |
93.98 - 98.40 |
2.4693 times |
Mon 20 October 2025 |
106.10 (2.9%) |
103.80 |
103.16 - 106.97 |
0.6303 times |
Fri 17 October 2025 |
103.11 (-7.69%) |
110.51 |
101.25 - 112.35 |
1.5809 times |
Thu 16 October 2025 |
111.70 (2.97%) |
108.65 |
107.86 - 113.62 |
0.6359 times |
Wed 15 October 2025 |
108.48 (4.69%) |
105.52 |
105.47 - 109.20 |
0.7483 times |
Tue 14 October 2025 |
103.62 (-1.45%) |
103.13 |
102.82 - 105.28 |
0.5814 times |
Mon 13 October 2025 |
105.14 (5.25%) |
103.35 |
103.16 - 105.51 |
1.0216 times |
Fri 10 October 2025 |
99.90 (0.01%) |
100.24 |
98.54 - 101.25 |
0.8496 times |
Weekly price and charts JuniorGold Strong weekly Stock price targets for JuniorGold GDXJ are 84.96 and 100.92 | Weekly Target 1 | 81.66 | | Weekly Target 2 | 88.26 | | Weekly Target 3 | 97.616666666667 | | Weekly Target 4 | 104.22 | | Weekly Target 5 | 113.58 |
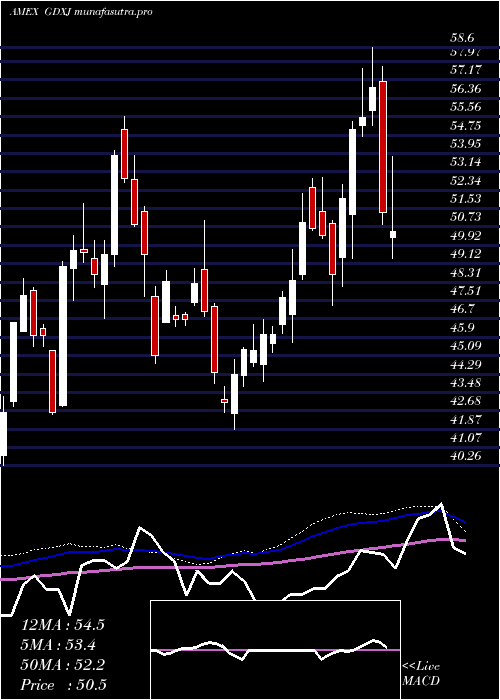
Weekly price and volumes for Junior Gold
| Date |
Closing |
Open |
Range |
Volume |
Fri 24 October 2025 |
94.87 (-7.99%) |
103.80 |
91.01 - 106.97 |
1.5362 times |
Fri 17 October 2025 |
103.11 (3.21%) |
103.35 |
101.25 - 113.62 |
1.2919 times |
Fri 10 October 2025 |
99.90 (0.16%) |
101.35 |
98.44 - 105.24 |
1.2147 times |
Fri 03 October 2025 |
99.74 (3.67%) |
98.93 |
95.71 - 101.36 |
0.9438 times |
Fri 26 September 2025 |
96.21 (4.6%) |
93.97 |
92.71 - 96.79 |
0.8833 times |
Fri 19 September 2025 |
91.98 (2.17%) |
89.92 |
85.60 - 92.42 |
1.1285 times |
Fri 12 September 2025 |
90.03 (6.09%) |
86.48 |
85.11 - 90.90 |
0.9732 times |
Fri 05 September 2025 |
84.86 (6.01%) |
81.88 |
80.06 - 85.67 |
0.9507 times |
Fri 29 August 2025 |
80.05 (0%) |
77.22 |
77.11 - 80.06 |
0.2641 times |
Fri 29 August 2025 |
80.05 (4.96%) |
75.98 |
75.83 - 80.06 |
0.8136 times |
Fri 22 August 2025 |
76.27 (3.23%) |
73.63 |
71.18 - 76.94 |
0.7101 times |
Monthly price and charts JuniorGold Strong monthly Stock price targets for JuniorGold GDXJ are 81.64 and 104.25 | Monthly Target 1 | 77.22 | | Monthly Target 2 | 86.05 | | Monthly Target 3 | 99.833333333333 | | Monthly Target 4 | 108.66 | | Monthly Target 5 | 122.44 |
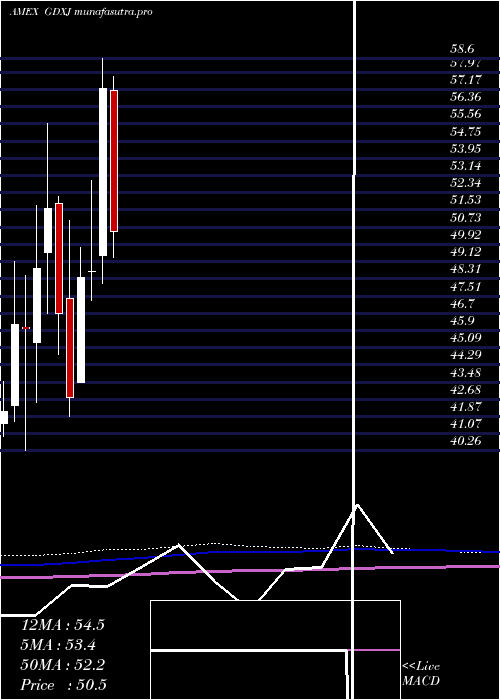
Monthly price and volumes Junior Gold
| Date |
Closing |
Open |
Range |
Volume |
Fri 24 October 2025 |
94.87 (-4.2%) |
100.45 |
91.01 - 113.62 |
1.2742 times |
Tue 30 September 2025 |
99.03 (23.71%) |
81.88 |
80.06 - 100.29 |
1.2012 times |
Fri 29 August 2025 |
80.05 (24.65%) |
65.62 |
64.53 - 80.06 |
0.9301 times |
Thu 31 July 2025 |
64.22 (-4.99%) |
68.61 |
63.90 - 70.53 |
0.8619 times |
Mon 30 June 2025 |
67.59 (3.48%) |
66.68 |
64.92 - 71.84 |
0.8659 times |
Fri 30 May 2025 |
65.32 (6.38%) |
59.82 |
57.40 - 65.48 |
1.1939 times |
Wed 30 April 2025 |
61.40 (7.34%) |
57.11 |
49.33 - 66.80 |
1.1984 times |
Mon 31 March 2025 |
57.20 (17.55%) |
49.41 |
48.11 - 58.60 |
0.7898 times |
Fri 28 February 2025 |
48.66 (0.6%) |
48.65 |
47.29 - 52.91 |
0.833 times |
Fri 31 January 2025 |
48.37 (13.15%) |
43.47 |
43.46 - 49.76 |
0.8516 times |
Tue 31 December 2024 |
42.75 (-8.4%) |
47.41 |
41.85 - 51.03 |
0.7062 times |
DMA SMA EMA moving averages of Junior Gold GDXJ
DMA (daily moving average) of Junior Gold GDXJ
| DMA period | DMA value | | 5 day DMA | 97.45 | | 12 day DMA | 101.59 | | 20 day DMA | 101.18 | | 35 day DMA | 96.7 | | 50 day DMA | 91.13 | | 100 day DMA | 79.92 | | 150 day DMA | 73.48 | | 200 day DMA | 67.61 | EMA (exponential moving average) of Junior Gold GDXJ
| EMA period | EMA current | EMA prev | EMA prev2 | | 5 day EMA | 97.36 | 98.6 | 99.88 | | 12 day EMA | 99.6 | 100.46 | 101.26 | | 20 day EMA | 98.99 | 99.42 | 99.77 | | 35 day EMA | 95.17 | 95.19 | 95.14 | | 50 day EMA | 90.24 | 90.05 | 89.8 |
SMA (simple moving average) of Junior Gold GDXJ
| SMA period | SMA current | SMA prev | SMA prev2 | | 5 day SMA | 97.45 | 99.1 | 102.23 | | 12 day SMA | 101.59 | 102.42 | 102.81 | | 20 day SMA | 101.18 | 101.25 | 101.15 | | 35 day SMA | 96.7 | 96.41 | 96.03 | | 50 day SMA | 91.13 | 90.71 | 90.24 | | 100 day SMA | 79.92 | 79.66 | 79.35 | | 150 day SMA | 73.48 | 73.22 | 72.96 | | 200 day SMA | 67.61 | 67.36 | 67.1 |
|
|
