MicrosectorsGold GDXD full analysis,charts,indicators,moving averages,SMA,DMA,EMA,ADX,MACD,RSIMicrosectors Gold GDXD WideScreen charts, DMA,SMA,EMA technical analysis, forecast prediction, by indicators ADX,MACD,RSI,CCI AMEX stock exchange
Daily price and charts and targets MicrosectorsGold Strong Daily Stock price targets for MicrosectorsGold GDXD are 15.57 and 17.13 | Daily Target 1 | 15.19 | | Daily Target 2 | 15.95 | | Daily Target 3 | 16.753333333333 | | Daily Target 4 | 17.51 | | Daily Target 5 | 18.31 |
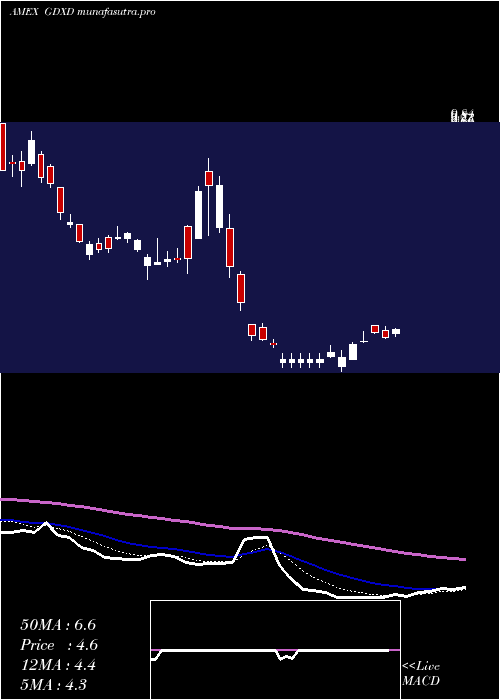
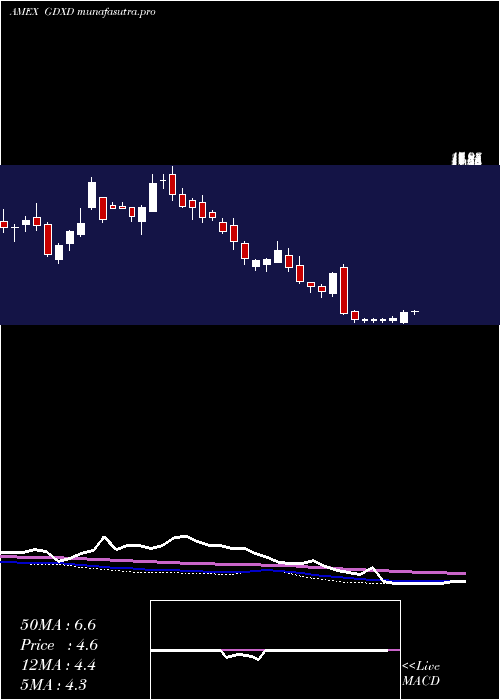
Daily price and volume Microsectors Gold
| Date |
Closing |
Open |
Range |
Volume |
Thu 23 October 2025 |
16.70 (-3.19%) |
17.01 |
16.00 - 17.56 |
0.0188 times |
Wed 22 October 2025 |
17.25 (1905.81%) |
19.24 |
16.97 - 19.24 |
0.0374 times |
Tue 21 October 2025 |
0.86 (28.36%) |
0.81 |
0.81 - 0.88 |
2.4187 times |
Mon 20 October 2025 |
0.67 (-6.94%) |
0.71 |
0.65 - 0.73 |
1.0705 times |
Fri 17 October 2025 |
0.72 (20%) |
0.62 |
0.58 - 0.75 |
2.148 times |
Thu 16 October 2025 |
0.60 (-10.45%) |
0.66 |
0.58 - 0.67 |
1.2709 times |
Wed 15 October 2025 |
0.67 (-11.84%) |
0.73 |
0.66 - 0.73 |
0.9055 times |
Tue 14 October 2025 |
0.76 (2.7%) |
0.78 |
0.73 - 0.78 |
0.5666 times |
Mon 13 October 2025 |
0.74 (-12.94%) |
0.78 |
0.73 - 0.78 |
0.6698 times |
Fri 10 October 2025 |
0.85 (-1.16%) |
0.85 |
0.82 - 0.88 |
0.8939 times |
Thu 09 October 2025 |
0.86 (13.16%) |
0.76 |
0.75 - 0.89 |
1.0015 times |
Weekly price and charts MicrosectorsGold Strong weekly Stock price targets for MicrosectorsGold GDXD are 8.68 and 27.27 | Weekly Target 1 | -6.39 | | Weekly Target 2 | 5.15 | | Weekly Target 3 | 12.196666666667 | | Weekly Target 4 | 23.74 | | Weekly Target 5 | 30.79 |
Weekly price and volumes for Microsectors Gold
| Date |
Closing |
Open |
Range |
Volume |
Thu 23 October 2025 |
16.70 (2219.44%) |
0.71 |
0.65 - 19.24 |
1.5079 times |
Fri 17 October 2025 |
0.72 (-15.29%) |
0.78 |
0.58 - 0.78 |
2.3652 times |
Fri 10 October 2025 |
0.85 (1.19%) |
0.80 |
0.75 - 0.89 |
1.6292 times |
Fri 03 October 2025 |
0.84 (-9.68%) |
0.87 |
0.81 - 0.94 |
1.3494 times |
Fri 26 September 2025 |
0.93 (-13.89%) |
1.01 |
0.92 - 1.04 |
0.7854 times |
Fri 19 September 2025 |
1.08 (-8.47%) |
1.20 |
1.07 - 1.32 |
0.7028 times |
Fri 12 September 2025 |
1.18 (-15.71%) |
1.32 |
1.16 - 1.38 |
0.5861 times |
Fri 05 September 2025 |
1.40 (-15.15%) |
1.57 |
1.35 - 1.64 |
0.5958 times |
Fri 29 August 2025 |
1.65 (0%) |
1.81 |
1.63 - 1.81 |
0.1236 times |
Fri 29 August 2025 |
1.65 (-13.61%) |
1.90 |
1.63 - 1.92 |
0.3547 times |
Fri 22 August 2025 |
1.91 (-10.33%) |
2.14 |
1.85 - 2.33 |
0.5643 times |
Monthly price and charts MicrosectorsGold Strong monthly Stock price targets for MicrosectorsGold GDXD are 8.64 and 27.3 | Monthly Target 1 | -6.49 | | Monthly Target 2 | 5.11 | | Monthly Target 3 | 12.173333333333 | | Monthly Target 4 | 23.77 | | Monthly Target 5 | 30.83 |
Monthly price and volumes Microsectors Gold
| Date |
Closing |
Open |
Range |
Volume |
Thu 23 October 2025 |
16.70 (1819.54%) |
0.84 |
0.58 - 19.24 |
3.2442 times |
Tue 30 September 2025 |
0.87 (-47.27%) |
1.57 |
0.84 - 1.64 |
1.5868 times |
Fri 29 August 2025 |
1.65 (-47.78%) |
2.95 |
1.63 - 3.11 |
1.1213 times |
Thu 31 July 2025 |
3.16 (2.6%) |
2.93 |
2.60 - 3.35 |
1.0303 times |
Mon 30 June 2025 |
3.08 (-13.24%) |
3.34 |
2.70 - 3.43 |
0.914 times |
Fri 30 May 2025 |
3.55 (-19.5%) |
4.77 |
3.52 - 5.15 |
0.6717 times |
Wed 30 April 2025 |
4.41 (-29.55%) |
6.29 |
3.45 - 8.95 |
0.8961 times |
Mon 31 March 2025 |
6.26 (-38.63%) |
9.71 |
5.83 - 10.39 |
0.2824 times |
Fri 28 February 2025 |
10.20 (-7.61%) |
10.87 |
8.29 - 11.08 |
0.1817 times |
Fri 31 January 2025 |
11.04 (-35.59%) |
16.34 |
10.32 - 16.34 |
0.0717 times |
Tue 31 December 2024 |
17.14 (21.3%) |
14.20 |
11.67 - 17.98 |
0.0379 times |

DMA SMA EMA moving averages of Microsectors Gold GDXD
DMA (daily moving average) of Microsectors Gold GDXD
| DMA period | DMA value | | 5 day DMA | 7.24 | | 12 day DMA | 3.45 | | 20 day DMA | 2.41 | | 35 day DMA | 1.88 | | 50 day DMA | 1.87 | | 100 day DMA | 2.38 | | 150 day DMA | 3.2 | | 200 day DMA | 4.95 | EMA (exponential moving average) of Microsectors Gold GDXD
| EMA period | EMA current | EMA prev | EMA prev2 | | 5 day EMA | 9.73 | 6.25 | 0.75 | | 12 day EMA | 5.36 | 3.3 | 0.77 | | 20 day EMA | 3.77 | 2.41 | 0.85 | | 35 day EMA | 2.8 | 1.98 | 1.08 | | 50 day EMA | 2.49 | 1.91 | 1.28 |
SMA (simple moving average) of Microsectors Gold GDXD
| SMA period | SMA current | SMA prev | SMA prev2 | | 5 day SMA | 7.24 | 4.02 | 0.7 | | 12 day SMA | 3.45 | 2.13 | 0.76 | | 20 day SMA | 2.41 | 1.63 | 0.82 | | 35 day SMA | 1.88 | 1.45 | 1 | | 50 day SMA | 1.87 | 1.58 | 1.28 | | 100 day SMA | 2.38 | 2.25 | 2.11 | | 150 day SMA | 3.2 | 3.14 | 3.07 | | 200 day SMA | 4.95 | 4.94 | 4.93 |
|
|
