GoldMiners GDX full analysis,charts,indicators,moving averages,SMA,DMA,EMA,ADX,MACD,RSIGold Miners GDX WideScreen charts, DMA,SMA,EMA technical analysis, forecast prediction, by indicators ADX,MACD,RSI,CCI AMEX stock exchange
Daily price and charts and targets GoldMiners Strong Daily Stock price targets for GoldMiners GDX are 73.09 and 75.4 | Daily Target 1 | 71.31 | | Daily Target 2 | 72.55 | | Daily Target 3 | 73.616666666667 | | Daily Target 4 | 74.86 | | Daily Target 5 | 75.93 |
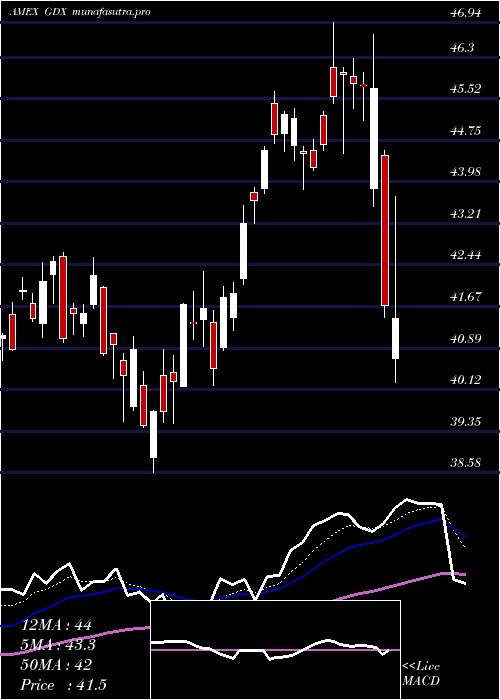
Daily price and volume Gold Miners
| Date |
Closing |
Open |
Range |
Volume |
Thu 23 October 2025 |
73.80 (1.22%) |
72.85 |
72.37 - 74.68 |
0.5117 times |
Wed 22 October 2025 |
72.91 (0.16%) |
73.20 |
69.62 - 73.68 |
1 times |
Tue 21 October 2025 |
72.79 (-9.42%) |
74.58 |
72.13 - 74.99 |
2.1223 times |
Mon 20 October 2025 |
80.36 (2.07%) |
78.92 |
78.51 - 81.02 |
0.6049 times |
Fri 17 October 2025 |
78.73 (-6.76%) |
84.30 |
77.18 - 85.44 |
1.7339 times |
Thu 16 October 2025 |
84.44 (3.65%) |
81.70 |
81.32 - 85.91 |
0.9738 times |
Wed 15 October 2025 |
81.47 (3.85%) |
79.51 |
79.24 - 81.74 |
0.9395 times |
Tue 14 October 2025 |
78.45 (-1.16%) |
78.03 |
77.61 - 79.40 |
0.5994 times |
Mon 13 October 2025 |
79.37 (4.74%) |
78.07 |
77.96 - 79.46 |
0.7755 times |
Fri 10 October 2025 |
75.78 (0.22%) |
75.86 |
75.08 - 76.62 |
0.739 times |
Thu 09 October 2025 |
75.61 (-4.47%) |
79.20 |
74.58 - 79.33 |
1.22 times |
Weekly price and charts GoldMiners Strong weekly Stock price targets for GoldMiners GDX are 66.01 and 77.41 | Weekly Target 1 | 63.41 | | Weekly Target 2 | 68.61 | | Weekly Target 3 | 74.813333333333 | | Weekly Target 4 | 80.01 | | Weekly Target 5 | 86.21 |
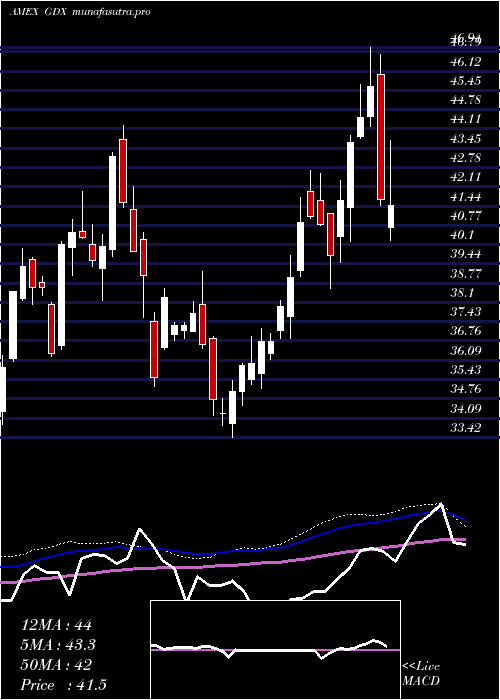
Weekly price and volumes for Gold Miners
| Date |
Closing |
Open |
Range |
Volume |
Thu 23 October 2025 |
73.80 (-6.26%) |
78.92 |
69.62 - 81.02 |
1.257 times |
Fri 17 October 2025 |
78.73 (3.89%) |
78.07 |
77.18 - 85.91 |
1.4893 times |
Fri 10 October 2025 |
75.78 (-1.69%) |
78.36 |
74.58 - 79.49 |
1.1992 times |
Fri 03 October 2025 |
77.08 (3.21%) |
76.58 |
74.10 - 78.32 |
1.0315 times |
Fri 26 September 2025 |
74.68 (3.21%) |
73.77 |
72.01 - 75.28 |
1.118 times |
Fri 19 September 2025 |
72.36 (3.74%) |
69.30 |
67.26 - 72.53 |
1.1069 times |
Fri 12 September 2025 |
69.75 (5.14%) |
67.23 |
66.49 - 70.11 |
0.8855 times |
Fri 05 September 2025 |
66.34 (5.02%) |
64.39 |
63.20 - 66.87 |
1.0965 times |
Fri 29 August 2025 |
63.17 (0%) |
61.21 |
61.21 - 63.23 |
0.1762 times |
Fri 29 August 2025 |
63.17 (4.97%) |
60.39 |
60.17 - 63.23 |
0.6399 times |
Fri 22 August 2025 |
60.18 (3.26%) |
58.20 |
56.59 - 60.68 |
0.6772 times |
Monthly price and charts GoldMiners Strong monthly Stock price targets for GoldMiners GDX are 63.57 and 79.86 | Monthly Target 1 | 60.15 | | Monthly Target 2 | 66.98 | | Monthly Target 3 | 76.443333333333 | | Monthly Target 4 | 83.27 | | Monthly Target 5 | 92.73 |
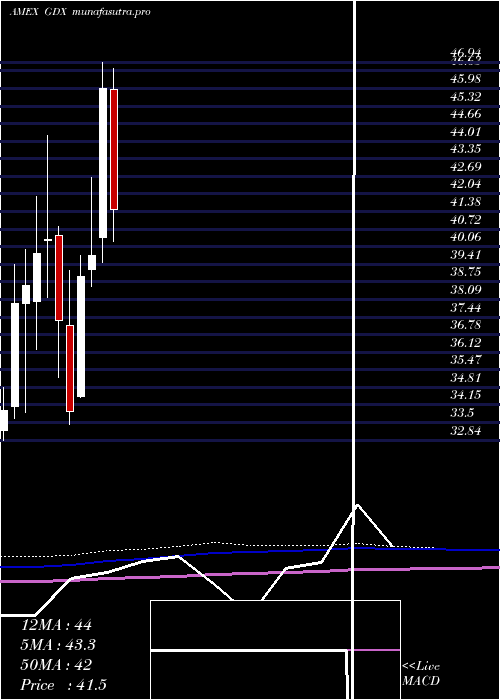
Monthly price and volumes Gold Miners
| Date |
Closing |
Open |
Range |
Volume |
Thu 23 October 2025 |
73.80 (-3.4%) |
77.11 |
69.62 - 85.91 |
1.208 times |
Tue 30 September 2025 |
76.40 (20.94%) |
64.39 |
63.20 - 77.18 |
1.2157 times |
Fri 29 August 2025 |
63.17 (22.33%) |
52.74 |
51.94 - 63.23 |
0.8008 times |
Thu 31 July 2025 |
51.64 (-0.81%) |
53.01 |
50.35 - 54.78 |
0.965 times |
Mon 30 June 2025 |
52.06 (2.78%) |
51.72 |
50.32 - 54.70 |
0.9505 times |
Fri 30 May 2025 |
50.65 (3.35%) |
47.55 |
45.10 - 50.84 |
1.0781 times |
Wed 30 April 2025 |
49.01 (6.61%) |
45.93 |
40.26 - 53.25 |
1.2203 times |
Mon 31 March 2025 |
45.97 (15.74%) |
40.39 |
39.49 - 46.94 |
0.8281 times |
Fri 28 February 2025 |
39.72 (1.95%) |
39.22 |
38.58 - 42.66 |
0.8412 times |
Fri 31 January 2025 |
38.96 (14.89%) |
34.46 |
34.44 - 39.73 |
0.8923 times |
Tue 31 December 2024 |
33.91 (-9.06%) |
37.10 |
33.42 - 39.17 |
0.6713 times |
DMA SMA EMA moving averages of Gold Miners GDX
DMA (daily moving average) of Gold Miners GDX
| DMA period | DMA value | | 5 day DMA | 75.72 | | 12 day DMA | 77.74 | | 20 day DMA | 77.33 | | 35 day DMA | 74.24 | | 50 day DMA | 70.29 | | 100 day DMA | 61.82 | | 150 day DMA | 57.26 | | 200 day DMA | 52.98 | EMA (exponential moving average) of Gold Miners GDX
| EMA period | EMA current | EMA prev | EMA prev2 | | 5 day EMA | 75.35 | 76.13 | 77.74 | | 12 day EMA | 76.63 | 77.15 | 77.92 | | 20 day EMA | 76.03 | 76.26 | 76.61 | | 35 day EMA | 73.22 | 73.19 | 73.21 | | 50 day EMA | 69.79 | 69.63 | 69.5 |
SMA (simple moving average) of Gold Miners GDX
| SMA period | SMA current | SMA prev | SMA prev2 | | 5 day SMA | 75.72 | 77.85 | 79.56 | | 12 day SMA | 77.74 | 78 | 78.48 | | 20 day SMA | 77.33 | 77.29 | 77.26 | | 35 day SMA | 74.24 | 73.97 | 73.75 | | 50 day SMA | 70.29 | 69.97 | 69.67 | | 100 day SMA | 61.82 | 61.58 | 61.36 | | 150 day SMA | 57.26 | 57.07 | 56.89 | | 200 day SMA | 52.98 | 52.79 | 52.6 |
|
|
