PacerGlobal GCOW full analysis,charts,indicators,moving averages,SMA,DMA,EMA,ADX,MACD,RSIPacer Global GCOW WideScreen charts, DMA,SMA,EMA technical analysis, forecast prediction, by indicators ADX,MACD,RSI,CCI AMEX stock exchange
Daily price and charts and targets PacerGlobal Strong Daily Stock price targets for PacerGlobal GCOW are 40.22 and 40.38 | Daily Target 1 | 40.09 | | Daily Target 2 | 40.18 | | Daily Target 3 | 40.246666666667 | | Daily Target 4 | 40.34 | | Daily Target 5 | 40.41 |
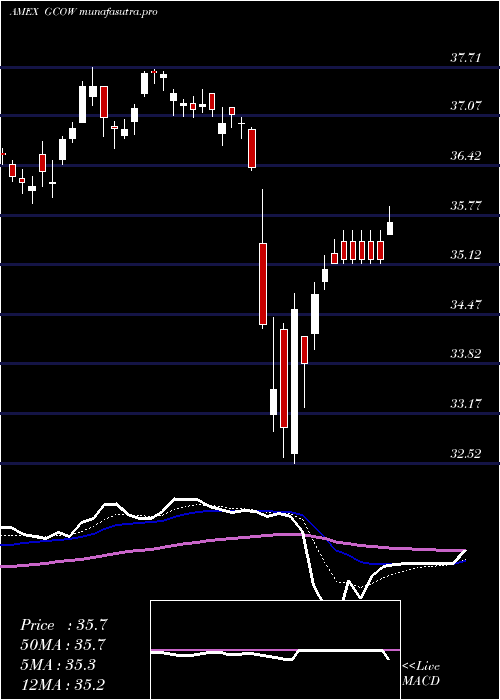
Daily price and volume Pacer Global
| Date |
Closing |
Open |
Range |
Volume |
Thu 23 October 2025 |
40.28 (0.42%) |
40.27 |
40.15 - 40.31 |
1.203 times |
Wed 22 October 2025 |
40.11 (0.22%) |
39.89 |
39.89 - 40.18 |
1.0562 times |
Tue 21 October 2025 |
40.02 (-0.35%) |
40.12 |
39.91 - 40.12 |
1.4039 times |
Mon 20 October 2025 |
40.16 (0.27%) |
40.07 |
40.02 - 40.16 |
0.9101 times |
Fri 17 October 2025 |
40.05 (0.98%) |
39.79 |
39.79 - 40.08 |
1.1335 times |
Thu 16 October 2025 |
39.66 (0.33%) |
39.73 |
39.56 - 39.88 |
0.5863 times |
Wed 15 October 2025 |
39.53 (0.36%) |
39.52 |
39.32 - 39.64 |
1.0866 times |
Tue 14 October 2025 |
39.39 (0.36%) |
39.17 |
39.08 - 39.47 |
0.9566 times |
Mon 13 October 2025 |
39.25 (0.41%) |
39.22 |
39.13 - 39.27 |
0.8387 times |
Fri 10 October 2025 |
39.09 (-1.49%) |
39.66 |
39.02 - 39.66 |
0.8251 times |
Thu 09 October 2025 |
39.68 (-0.4%) |
40.01 |
39.57 - 40.02 |
1.4923 times |
Weekly price and charts PacerGlobal Strong weekly Stock price targets for PacerGlobal GCOW are 40.09 and 40.51 | Weekly Target 1 | 39.74 | | Weekly Target 2 | 40.01 | | Weekly Target 3 | 40.16 | | Weekly Target 4 | 40.43 | | Weekly Target 5 | 40.58 |
Weekly price and volumes for Pacer Global
| Date |
Closing |
Open |
Range |
Volume |
Thu 23 October 2025 |
40.28 (0.57%) |
40.07 |
39.89 - 40.31 |
0.9681 times |
Fri 17 October 2025 |
40.05 (2.46%) |
39.22 |
39.08 - 40.08 |
0.9741 times |
Fri 10 October 2025 |
39.09 (-2.59%) |
40.11 |
39.02 - 40.11 |
1.0316 times |
Fri 03 October 2025 |
40.13 (1.75%) |
39.41 |
39.20 - 40.26 |
0.9324 times |
Fri 26 September 2025 |
39.44 (0.46%) |
39.34 |
39.12 - 39.57 |
0.9784 times |
Fri 19 September 2025 |
39.26 (-0.86%) |
39.74 |
39.24 - 39.96 |
1.0724 times |
Fri 12 September 2025 |
39.60 (-0.28%) |
39.78 |
39.48 - 39.98 |
1.6814 times |
Fri 05 September 2025 |
39.71 (-1.1%) |
39.86 |
39.41 - 40.10 |
1.1271 times |
Fri 29 August 2025 |
40.15 (0%) |
39.96 |
39.77 - 40.15 |
0.1503 times |
Fri 29 August 2025 |
40.15 (-1.35%) |
40.51 |
39.72 - 40.53 |
1.0841 times |
Fri 22 August 2025 |
40.70 (1.88%) |
39.90 |
39.77 - 40.76 |
1.5043 times |

Monthly price and charts PacerGlobal Strong monthly Stock price targets for PacerGlobal GCOW are 39.65 and 40.94 | Monthly Target 1 | 38.58 | | Monthly Target 2 | 39.43 | | Monthly Target 3 | 39.87 | | Monthly Target 4 | 40.72 | | Monthly Target 5 | 41.16 |
Monthly price and volumes Pacer Global
| Date |
Closing |
Open |
Range |
Volume |
Thu 23 October 2025 |
40.28 (1.67%) |
39.86 |
39.02 - 40.31 |
0.4375 times |
Tue 30 September 2025 |
39.62 (-1.32%) |
39.86 |
39.12 - 40.10 |
0.6611 times |
Fri 29 August 2025 |
40.15 (5.38%) |
38.33 |
37.96 - 40.76 |
0.71 times |
Thu 31 July 2025 |
38.10 (0.34%) |
38.06 |
37.94 - 39.70 |
0.8394 times |
Mon 30 June 2025 |
37.97 (0.85%) |
37.81 |
37.36 - 38.57 |
0.9738 times |
Fri 30 May 2025 |
37.65 (2.39%) |
36.82 |
36.50 - 37.89 |
0.8274 times |
Wed 30 April 2025 |
36.77 (-0.57%) |
37.18 |
32.52 - 37.18 |
1.6514 times |
Mon 31 March 2025 |
36.98 (2.3%) |
36.56 |
36.00 - 37.71 |
1.5526 times |
Fri 28 February 2025 |
36.15 (4.18%) |
34.22 |
33.82 - 36.65 |
1.018 times |
Fri 31 January 2025 |
34.70 (2.85%) |
33.83 |
33.45 - 35.10 |
1.3288 times |
Tue 31 December 2024 |
33.74 (-3.54%) |
35.43 |
33.33 - 35.56 |
0.9325 times |

DMA SMA EMA moving averages of Pacer Global GCOW
DMA (daily moving average) of Pacer Global GCOW
| DMA period | DMA value | | 5 day DMA | 40.12 | | 12 day DMA | 39.76 | | 20 day DMA | 39.77 | | 35 day DMA | 39.67 | | 50 day DMA | 39.8 | | 100 day DMA | 39.13 | | 150 day DMA | 38.2 | | 200 day DMA | 37.56 | EMA (exponential moving average) of Pacer Global GCOW
| EMA period | EMA current | EMA prev | EMA prev2 | | 5 day EMA | 40.08 | 39.98 | 39.91 | | 12 day EMA | 39.89 | 39.82 | 39.77 | | 20 day EMA | 39.82 | 39.77 | 39.73 | | 35 day EMA | 39.8 | 39.77 | 39.75 | | 50 day EMA | 39.8 | 39.78 | 39.77 |
SMA (simple moving average) of Pacer Global GCOW
| SMA period | SMA current | SMA prev | SMA prev2 | | 5 day SMA | 40.12 | 40 | 39.88 | | 12 day SMA | 39.76 | 39.72 | 39.71 | | 20 day SMA | 39.77 | 39.72 | 39.68 | | 35 day SMA | 39.67 | 39.66 | 39.65 | | 50 day SMA | 39.8 | 39.79 | 39.78 | | 100 day SMA | 39.13 | 39.1 | 39.08 | | 150 day SMA | 38.2 | 38.18 | 38.17 | | 200 day SMA | 37.56 | 37.53 | 37.5 |
|
|
