GoldmanSachs GCOR full analysis,charts,indicators,moving averages,SMA,DMA,EMA,ADX,MACD,RSIGoldman Sachs GCOR WideScreen charts, DMA,SMA,EMA technical analysis, forecast prediction, by indicators ADX,MACD,RSI,CCI AMEX stock exchange
Daily price and charts and targets GoldmanSachs Strong Daily Stock price targets for GoldmanSachs GCOR are 41.98 and 42.06 | Daily Target 1 | 41.97 | | Daily Target 2 | 41.99 | | Daily Target 3 | 42.046666666667 | | Daily Target 4 | 42.07 | | Daily Target 5 | 42.13 |
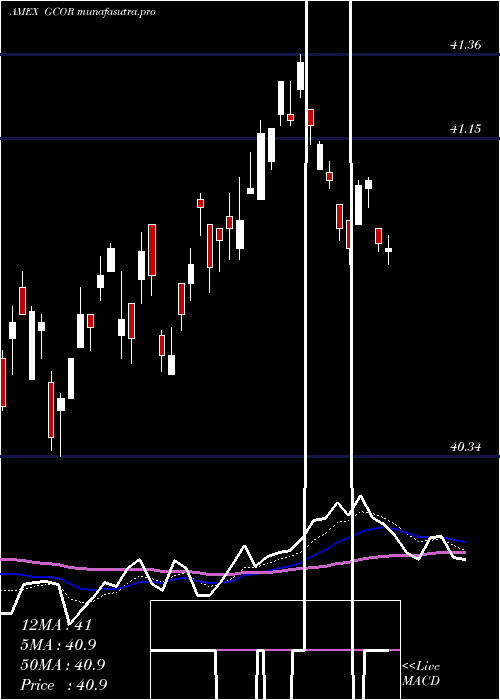
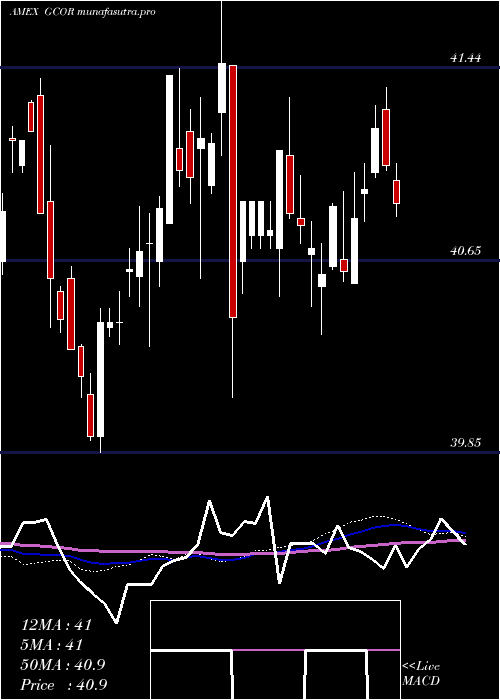
Daily price and volume Goldman Sachs
| Date |
Closing |
Open |
Range |
Volume |
Thu 23 October 2025 |
42.02 (-0.26%) |
42.07 |
42.02 - 42.10 |
0.9714 times |
Wed 22 October 2025 |
42.13 (0.02%) |
42.10 |
42.06 - 42.14 |
1.6078 times |
Tue 21 October 2025 |
42.12 (0.14%) |
42.15 |
42.09 - 42.17 |
1.2006 times |
Mon 20 October 2025 |
42.06 (0.1%) |
42.02 |
42.02 - 42.08 |
1.0754 times |
Fri 17 October 2025 |
42.02 (-0.05%) |
42.00 |
41.95 - 42.03 |
0.6433 times |
Thu 16 October 2025 |
42.04 (0.33%) |
41.93 |
41.88 - 42.07 |
1.1823 times |
Wed 15 October 2025 |
41.90 (-0.02%) |
41.97 |
41.88 - 41.98 |
0.7062 times |
Tue 14 October 2025 |
41.91 (0.14%) |
41.84 |
41.82 - 41.95 |
0.8525 times |
Mon 13 October 2025 |
41.85 (0.14%) |
41.76 |
41.70 - 41.88 |
0.8525 times |
Fri 10 October 2025 |
41.79 (0.36%) |
41.74 |
41.71 - 41.82 |
0.908 times |
Thu 09 October 2025 |
41.64 (-0.07%) |
41.60 |
41.60 - 41.67 |
1.6319 times |
Weekly price and charts GoldmanSachs Strong weekly Stock price targets for GoldmanSachs GCOR are 41.95 and 42.1 | Weekly Target 1 | 41.92 | | Weekly Target 2 | 41.97 | | Weekly Target 3 | 42.07 | | Weekly Target 4 | 42.12 | | Weekly Target 5 | 42.22 |
Weekly price and volumes for Goldman Sachs
| Date |
Closing |
Open |
Range |
Volume |
Thu 23 October 2025 |
42.02 (0%) |
42.02 |
42.02 - 42.17 |
0.885 times |
Fri 17 October 2025 |
42.02 (0.55%) |
41.76 |
41.70 - 42.07 |
0.7722 times |
Fri 10 October 2025 |
41.79 (0.26%) |
41.61 |
41.59 - 41.82 |
1.7561 times |
Fri 03 October 2025 |
41.68 (0%) |
41.77 |
41.62 - 41.88 |
1.0868 times |
Fri 26 September 2025 |
41.68 (-0.24%) |
41.81 |
41.62 - 41.83 |
1.0762 times |
Fri 19 September 2025 |
41.78 (-0.26%) |
41.97 |
41.76 - 42.11 |
1.1929 times |
Fri 12 September 2025 |
41.89 (0.5%) |
41.78 |
41.74 - 42.00 |
1.1957 times |
Fri 05 September 2025 |
41.68 (0.63%) |
41.14 |
41.14 - 41.74 |
0.8243 times |
Fri 29 August 2025 |
41.42 (0%) |
41.43 |
41.38 - 41.46 |
0.1163 times |
Fri 29 August 2025 |
41.42 (0.07%) |
41.30 |
41.29 - 41.48 |
1.0946 times |
Fri 22 August 2025 |
41.39 (0.41%) |
41.20 |
41.14 - 41.40 |
5.0628 times |
Monthly price and charts GoldmanSachs Strong monthly Stock price targets for GoldmanSachs GCOR are 41.81 and 42.39 | Monthly Target 1 | 41.35 | | Monthly Target 2 | 41.68 | | Monthly Target 3 | 41.926666666667 | | Monthly Target 4 | 42.26 | | Monthly Target 5 | 42.51 |
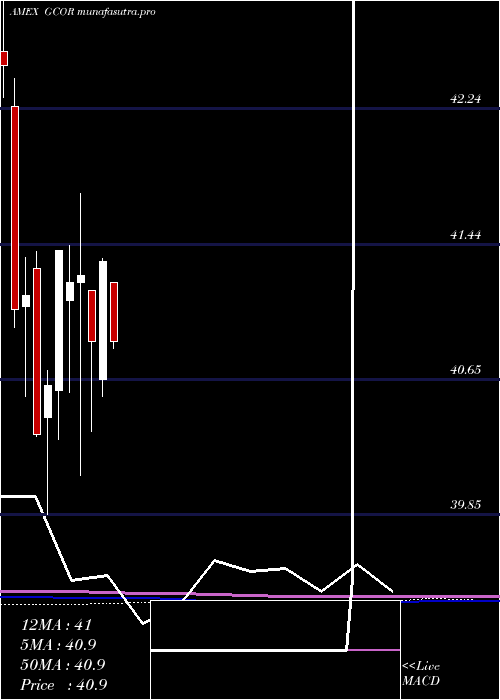
Monthly price and volumes Goldman Sachs
| Date |
Closing |
Open |
Range |
Volume |
Thu 23 October 2025 |
42.02 (0.57%) |
41.70 |
41.59 - 42.17 |
0.6704 times |
Tue 30 September 2025 |
41.78 (0.87%) |
41.14 |
41.14 - 42.11 |
0.7746 times |
Fri 29 August 2025 |
41.42 (0.83%) |
41.20 |
41.14 - 41.48 |
1.3315 times |
Thu 31 July 2025 |
41.08 (-0.63%) |
41.22 |
40.71 - 41.22 |
1.0274 times |
Mon 30 June 2025 |
41.34 (1.15%) |
40.65 |
40.55 - 41.36 |
1.0492 times |
Fri 30 May 2025 |
40.87 (-0.95%) |
41.17 |
40.34 - 41.17 |
1.0024 times |
Wed 30 April 2025 |
41.26 (0.1%) |
41.22 |
40.08 - 41.74 |
1.2882 times |
Mon 31 March 2025 |
41.22 (-0.46%) |
41.11 |
40.57 - 41.44 |
1.7065 times |
Fri 28 February 2025 |
41.41 (1.97%) |
40.58 |
40.29 - 41.41 |
0.5642 times |
Fri 31 January 2025 |
40.61 (0.72%) |
40.42 |
39.85 - 40.70 |
0.5856 times |
Tue 31 December 2024 |
40.32 (-1.99%) |
41.30 |
40.31 - 41.40 |
0.536 times |
DMA SMA EMA moving averages of Goldman Sachs GCOR
DMA (daily moving average) of Goldman Sachs GCOR
| DMA period | DMA value | | 5 day DMA | 42.07 | | 12 day DMA | 41.93 | | 20 day DMA | 41.84 | | 35 day DMA | 41.84 | | 50 day DMA | 41.69 | | 100 day DMA | 41.35 | | 150 day DMA | 41.18 | | 200 day DMA | 41.07 | EMA (exponential moving average) of Goldman Sachs GCOR
| EMA period | EMA current | EMA prev | EMA prev2 | | 5 day EMA | 42.05 | 42.06 | 42.03 | | 12 day EMA | 41.96 | 41.95 | 41.92 | | 20 day EMA | 41.9 | 41.89 | 41.86 | | 35 day EMA | 41.77 | 41.75 | 41.73 | | 50 day EMA | 41.7 | 41.69 | 41.67 |
SMA (simple moving average) of Goldman Sachs GCOR
| SMA period | SMA current | SMA prev | SMA prev2 | | 5 day SMA | 42.07 | 42.07 | 42.03 | | 12 day SMA | 41.93 | 41.9 | 41.86 | | 20 day SMA | 41.84 | 41.82 | 41.8 | | 35 day SMA | 41.84 | 41.82 | 41.8 | | 50 day SMA | 41.69 | 41.67 | 41.66 | | 100 day SMA | 41.35 | 41.34 | 41.32 | | 150 day SMA | 41.18 | 41.18 | 41.17 | | 200 day SMA | 41.07 | 41.06 | 41.05 |
|
|
