NewConcept GBR full analysis,charts,indicators,moving averages,SMA,DMA,EMA,ADX,MACD,RSINew Concept GBR WideScreen charts, DMA,SMA,EMA technical analysis, forecast prediction, by indicators ADX,MACD,RSI,CCI AMEX stock exchange
Daily price and charts and targets NewConcept Strong Daily Stock price targets for NewConcept GBR are 0.73 and 1.06 | Daily Target 1 | 0.66 | | Daily Target 2 | 0.8 | | Daily Target 3 | 0.99333333333333 | | Daily Target 4 | 1.13 | | Daily Target 5 | 1.32 |
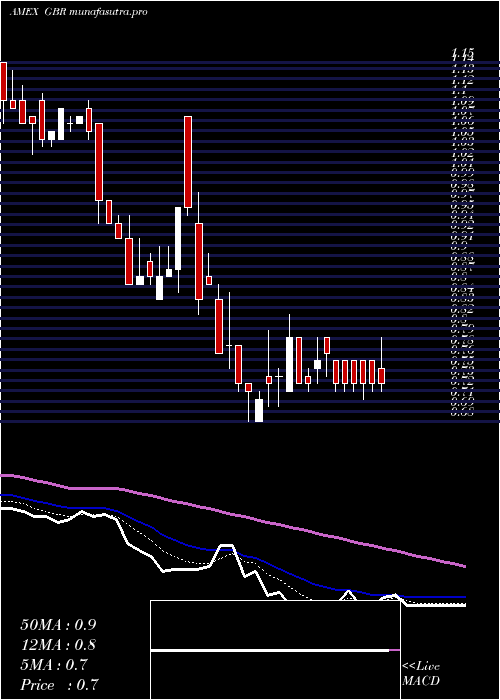
Daily price and volume New Concept
| Date |
Closing |
Open |
Range |
Volume |
Thu 23 October 2025 |
0.93 (6.9%) |
1.18 |
0.86 - 1.19 |
2.743 times |
Wed 22 October 2025 |
0.87 (-3.33%) |
0.97 |
0.87 - 0.97 |
0.9313 times |
Tue 21 October 2025 |
0.90 (3.45%) |
0.86 |
0.86 - 0.93 |
0.9559 times |
Mon 20 October 2025 |
0.87 (1.16%) |
0.90 |
0.84 - 0.90 |
0.4085 times |
Fri 17 October 2025 |
0.86 (-5.49%) |
0.89 |
0.86 - 0.90 |
1.4333 times |
Thu 16 October 2025 |
0.91 (-2.15%) |
0.93 |
0.91 - 0.93 |
0.4857 times |
Wed 15 October 2025 |
0.93 (-1.06%) |
0.95 |
0.92 - 0.96 |
0.9975 times |
Tue 14 October 2025 |
0.94 (1.08%) |
0.94 |
0.91 - 0.98 |
1.1305 times |
Mon 13 October 2025 |
0.93 (-2.11%) |
0.95 |
0.92 - 0.95 |
0.5071 times |
Fri 10 October 2025 |
0.95 (-5%) |
0.99 |
0.95 - 0.99 |
0.4073 times |
Thu 09 October 2025 |
1.00 (-1.96%) |
1.01 |
0.98 - 1.02 |
0.8673 times |
Weekly price and charts NewConcept Strong weekly Stock price targets for NewConcept GBR are 0.89 and 1.24 | Weekly Target 1 | 0.64 | | Weekly Target 2 | 0.78 | | Weekly Target 3 | 0.98666666666667 | | Weekly Target 4 | 1.13 | | Weekly Target 5 | 1.34 |
Weekly price and volumes for New Concept
| Date |
Closing |
Open |
Range |
Volume |
Thu 23 October 2025 |
0.93 (8.14%) |
0.90 |
0.84 - 1.19 |
0.2754 times |
Fri 17 October 2025 |
0.86 (-9.47%) |
0.95 |
0.86 - 0.98 |
0.2489 times |
Fri 10 October 2025 |
0.95 (-6.86%) |
1.02 |
0.95 - 1.04 |
0.1771 times |
Fri 03 October 2025 |
1.02 (-4.67%) |
1.07 |
0.96 - 1.07 |
0.2843 times |
Fri 26 September 2025 |
1.07 (1.9%) |
1.06 |
0.98 - 1.10 |
0.3335 times |
Fri 19 September 2025 |
1.05 (-4.55%) |
1.11 |
1.05 - 1.26 |
0.6873 times |
Fri 12 September 2025 |
1.10 (13.4%) |
0.97 |
0.96 - 1.13 |
0.5036 times |
Fri 05 September 2025 |
0.97 (-3.96%) |
0.98 |
0.95 - 1.07 |
0.3182 times |
Fri 29 August 2025 |
1.01 (0%) |
1.03 |
0.97 - 1.04 |
0.3196 times |
Fri 29 August 2025 |
1.01 (12.22%) |
0.84 |
0.75 - 1.21 |
6.8519 times |
Fri 22 August 2025 |
0.90 (-10%) |
0.99 |
0.77 - 1.19 |
0.4065 times |

Monthly price and charts NewConcept Strong monthly Stock price targets for NewConcept GBR are 0.71 and 1.06 | Monthly Target 1 | 0.64 | | Monthly Target 2 | 0.78 | | Monthly Target 3 | 0.98666666666667 | | Monthly Target 4 | 1.13 | | Monthly Target 5 | 1.34 |
Monthly price and volumes New Concept
| Date |
Closing |
Open |
Range |
Volume |
Thu 23 October 2025 |
0.93 (-7%) |
1.00 |
0.84 - 1.19 |
0.3036 times |
Tue 30 September 2025 |
1.00 (-0.99%) |
0.98 |
0.95 - 1.26 |
0.735 times |
Fri 29 August 2025 |
1.01 (10.99%) |
0.90 |
0.75 - 1.21 |
2.9891 times |
Thu 31 July 2025 |
0.91 (-19.47%) |
1.15 |
0.10 - 1.23 |
0.3166 times |
Mon 30 June 2025 |
1.13 (24.18%) |
0.95 |
0.90 - 1.78 |
2.405 times |
Fri 30 May 2025 |
0.91 (33.82%) |
0.72 |
0.68 - 1.00 |
0.36 times |
Wed 30 April 2025 |
0.68 (-11.69%) |
0.78 |
0.67 - 0.85 |
0.2612 times |
Mon 31 March 2025 |
0.77 (-28.04%) |
1.10 |
0.77 - 1.11 |
0.3465 times |
Fri 28 February 2025 |
1.07 (-7.76%) |
1.13 |
1.03 - 1.40 |
0.3589 times |
Fri 31 January 2025 |
1.16 (0%) |
1.16 |
1.12 - 1.65 |
1.9241 times |
Tue 31 December 2024 |
1.16 (-4.92%) |
1.18 |
1.08 - 1.24 |
0.1927 times |

DMA SMA EMA moving averages of New Concept GBR
DMA (daily moving average) of New Concept GBR
| DMA period | DMA value | | 5 day DMA | 0.89 | | 12 day DMA | 0.93 | | 20 day DMA | 0.96 | | 35 day DMA | 1.01 | | 50 day DMA | 1 | | 100 day DMA | 1.01 | | 150 day DMA | 0.94 | | 200 day DMA | 0.99 | EMA (exponential moving average) of New Concept GBR
| EMA period | EMA current | EMA prev | EMA prev2 | | 5 day EMA | 0.9 | 0.89 | 0.9 | | 12 day EMA | 0.93 | 0.93 | 0.94 | | 20 day EMA | 0.94 | 0.94 | 0.95 | | 35 day EMA | 0.96 | 0.96 | 0.97 | | 50 day EMA | 0.98 | 0.98 | 0.98 |
SMA (simple moving average) of New Concept GBR
| SMA period | SMA current | SMA prev | SMA prev2 | | 5 day SMA | 0.89 | 0.88 | 0.89 | | 12 day SMA | 0.93 | 0.93 | 0.95 | | 20 day SMA | 0.96 | 0.97 | 0.98 | | 35 day SMA | 1.01 | 1.01 | 1.02 | | 50 day SMA | 1 | 0.99 | 0.99 | | 100 day SMA | 1.01 | 1.01 | 1.01 | | 150 day SMA | 0.94 | 0.94 | 0.94 | | 200 day SMA | 0.99 | 0.99 | 0.99 |
|
|
