GsTreasuryaccess GBIL full analysis,charts,indicators,moving averages,SMA,DMA,EMA,ADX,MACD,RSIGs Treasuryaccess GBIL WideScreen charts, DMA,SMA,EMA technical analysis, forecast prediction, by indicators ADX,MACD,RSI,CCI AMEX stock exchange
Daily price and charts and targets GsTreasuryaccess Strong Daily Stock price targets for GsTreasuryaccess GBIL are 100.18 and 100.19 | Daily Target 1 | 100.17 | | Daily Target 2 | 100.17 | | Daily Target 3 | 100.17666666667 | | Daily Target 4 | 100.18 | | Daily Target 5 | 100.19 |
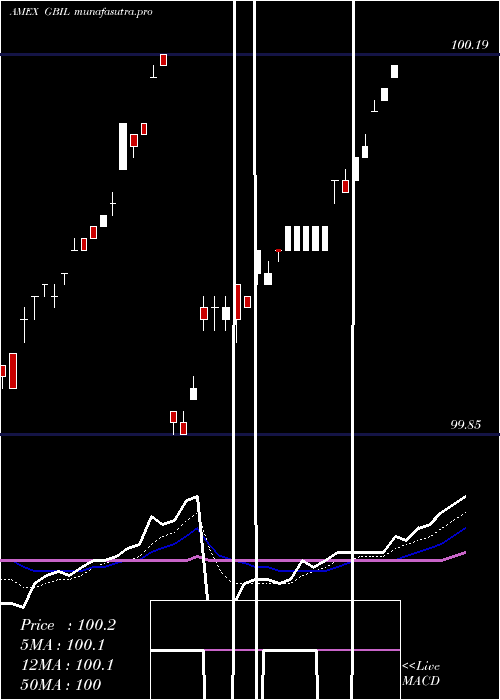
Daily price and volume Gs Treasuryaccess
| Date |
Closing |
Open |
Range |
Volume |
Fri 24 October 2025 |
100.18 (0.03%) |
100.17 |
100.17 - 100.18 |
1.1469 times |
Thu 23 October 2025 |
100.15 (0.01%) |
100.14 |
100.14 - 100.15 |
1.0813 times |
Wed 22 October 2025 |
100.14 (0.02%) |
100.13 |
100.13 - 100.14 |
0.6662 times |
Tue 21 October 2025 |
100.12 (0.01%) |
100.11 |
100.11 - 100.13 |
0.8735 times |
Mon 20 October 2025 |
100.11 (0.02%) |
100.11 |
100.10 - 100.12 |
1.0156 times |
Fri 17 October 2025 |
100.09 (0.01%) |
100.10 |
100.09 - 100.11 |
0.8968 times |
Thu 16 October 2025 |
100.08 (0.04%) |
100.06 |
100.05 - 100.08 |
1.7699 times |
Wed 15 October 2025 |
100.04 (-0.01%) |
100.05 |
100.04 - 100.06 |
0.8033 times |
Tue 14 October 2025 |
100.05 (0.01%) |
100.04 |
100.04 - 100.05 |
0.8834 times |
Mon 13 October 2025 |
100.04 (0.06%) |
100.03 |
100.03 - 100.04 |
0.8632 times |
Tue 07 October 2025 |
99.98 (0.02%) |
99.97 |
99.96 - 99.98 |
0.7113 times |
Weekly price and charts GsTreasuryaccess Strong weekly Stock price targets for GsTreasuryaccess GBIL are 100.14 and 100.22 | Weekly Target 1 | 100.07 | | Weekly Target 2 | 100.13 | | Weekly Target 3 | 100.15333333333 | | Weekly Target 4 | 100.21 | | Weekly Target 5 | 100.23 |
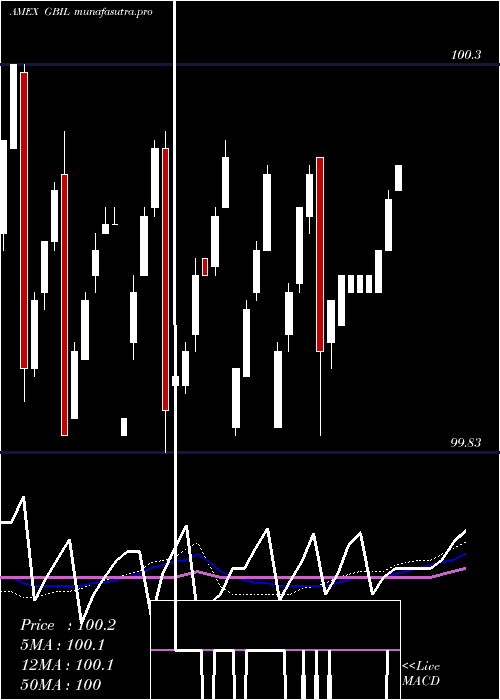
Weekly price and volumes for Gs Treasuryaccess
| Date |
Closing |
Open |
Range |
Volume |
Fri 24 October 2025 |
100.18 (0.09%) |
100.11 |
100.10 - 100.18 |
1.2622 times |
Fri 17 October 2025 |
100.09 (0.11%) |
100.03 |
100.03 - 100.11 |
1.3765 times |
Tue 07 October 2025 |
99.98 (0.03%) |
99.96 |
99.96 - 99.98 |
0.3421 times |
Fri 03 October 2025 |
99.95 (-0.26%) |
100.22 |
99.91 - 100.24 |
1.3001 times |
Fri 26 September 2025 |
100.21 (0.07%) |
100.16 |
100.15 - 100.22 |
1.3007 times |
Fri 19 September 2025 |
100.14 (0.08%) |
100.07 |
100.07 - 100.16 |
1.0746 times |
Fri 12 September 2025 |
100.06 (0.07%) |
100.01 |
100.00 - 100.08 |
1.4957 times |
Fri 05 September 2025 |
99.99 (-0.22%) |
99.89 |
99.89 - 100.00 |
0.7956 times |
Fri 29 August 2025 |
100.21 (0%) |
100.20 |
100.20 - 100.21 |
0.1742 times |
Fri 29 August 2025 |
100.21 (0.09%) |
100.12 |
100.12 - 100.21 |
0.8782 times |
Fri 22 August 2025 |
100.12 (0.09%) |
100.05 |
100.04 - 100.13 |
1.1802 times |
Monthly price and charts GsTreasuryaccess Strong monthly Stock price targets for GsTreasuryaccess GBIL are 100.05 and 100.32 | Monthly Target 1 | 99.82 | | Monthly Target 2 | 100 | | Monthly Target 3 | 100.09 | | Monthly Target 4 | 100.27 | | Monthly Target 5 | 100.36 |
Monthly price and volumes Gs Treasuryaccess
| Date |
Closing |
Open |
Range |
Volume |
Fri 24 October 2025 |
100.18 (-0.05%) |
99.91 |
99.91 - 100.18 |
0.6186 times |
Tue 30 September 2025 |
100.23 (0.02%) |
99.89 |
99.89 - 100.24 |
0.8466 times |
Fri 29 August 2025 |
100.21 (0.08%) |
99.85 |
99.85 - 100.21 |
0.7781 times |
Thu 31 July 2025 |
100.13 (-0.02%) |
99.83 |
99.82 - 100.15 |
0.9745 times |
Mon 30 June 2025 |
100.15 (-0.01%) |
99.82 |
99.82 - 100.17 |
1.1692 times |
Fri 30 May 2025 |
100.16 (-0.02%) |
99.86 |
99.85 - 100.16 |
1.1438 times |
Wed 30 April 2025 |
100.18 (0%) |
99.87 |
99.85 - 100.19 |
1.4868 times |
Mon 31 March 2025 |
100.18 (0.01%) |
99.86 |
99.86 - 100.19 |
1.1367 times |
Fri 28 February 2025 |
100.17 (-0.02%) |
99.86 |
99.85 - 100.18 |
0.8773 times |
Fri 31 January 2025 |
100.19 (0.27%) |
99.84 |
99.84 - 100.21 |
0.9683 times |
Tue 31 December 2024 |
99.92 (-0.19%) |
99.85 |
99.83 - 100.22 |
0.8196 times |

DMA SMA EMA moving averages of Gs Treasuryaccess GBIL
DMA (daily moving average) of Gs Treasuryaccess GBIL
| DMA period | DMA value | | 5 day DMA | 100.14 | | 12 day DMA | 100.08 | | 20 day DMA | 100.09 | | 35 day DMA | 100.07 | | 50 day DMA | 100.08 | | 100 day DMA | 100.03 | | 150 day DMA | 100.03 | | 200 day DMA | 100.02 | EMA (exponential moving average) of Gs Treasuryaccess GBIL
| EMA period | EMA current | EMA prev | EMA prev2 | | 5 day EMA | 100.14 | 100.12 | 100.11 | | 12 day EMA | 100.11 | 100.1 | 100.09 | | 20 day EMA | 100.1 | 100.09 | 100.08 | | 35 day EMA | 100.08 | 100.07 | 100.06 | | 50 day EMA | 100.06 | 100.06 | 100.06 |
SMA (simple moving average) of Gs Treasuryaccess GBIL
| SMA period | SMA current | SMA prev | SMA prev2 | | 5 day SMA | 100.14 | 100.12 | 100.11 | | 12 day SMA | 100.08 | 100.06 | 100.04 | | 20 day SMA | 100.09 | 100.09 | 100.09 | | 35 day SMA | 100.07 | 100.07 | 100.07 | | 50 day SMA | 100.08 | 100.07 | 100.07 | | 100 day SMA | 100.03 | 100.03 | 100.03 | | 150 day SMA | 100.03 | 100.03 | 100.03 | | 200 day SMA | 100.02 | 100.02 | 100.02 |
|
|
