GovernmentCredit GBF full analysis,charts,indicators,moving averages,SMA,DMA,EMA,ADX,MACD,RSIGovernment Credit GBF WideScreen charts, DMA,SMA,EMA technical analysis, forecast prediction, by indicators ADX,MACD,RSI,CCI AMEX stock exchange
Daily price and charts and targets GovernmentCredit Strong Daily Stock price targets for GovernmentCredit GBF are 106.15 and 106.26 | Daily Target 1 | 106.13 | | Daily Target 2 | 106.16 | | Daily Target 3 | 106.23666666667 | | Daily Target 4 | 106.27 | | Daily Target 5 | 106.35 |
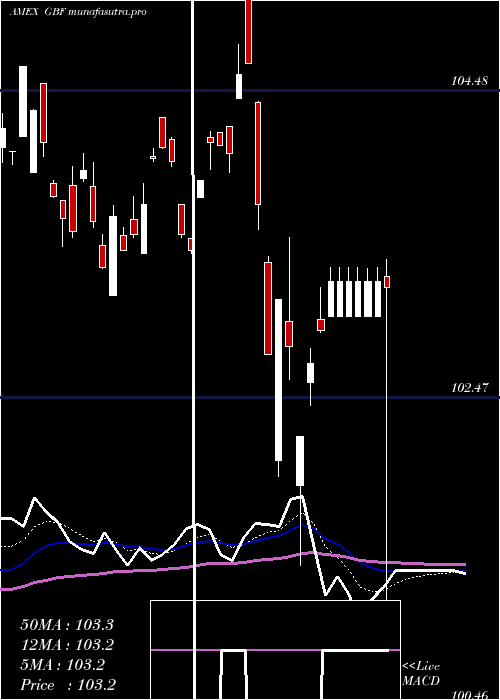
Daily price and volume Government Credit
| Date |
Closing |
Open |
Range |
Volume |
Thu 23 October 2025 |
106.20 (-0.1%) |
106.31 |
106.20 - 106.31 |
0.1146 times |
Wed 22 October 2025 |
106.31 (-0.07%) |
106.31 |
106.31 - 106.31 |
0.0136 times |
Tue 21 October 2025 |
106.38 (0.12%) |
106.39 |
106.34 - 106.39 |
0.2306 times |
Mon 20 October 2025 |
106.25 (0.17%) |
106.22 |
106.14 - 106.25 |
0.1484 times |
Fri 17 October 2025 |
106.07 (-0.12%) |
106.05 |
106.04 - 106.10 |
0.056 times |
Thu 16 October 2025 |
106.20 (0.34%) |
105.87 |
105.82 - 106.25 |
8.4874 times |
Wed 15 October 2025 |
105.84 (-0.08%) |
106.05 |
105.84 - 106.05 |
0.1628 times |
Tue 14 October 2025 |
105.92 (0.18%) |
105.78 |
105.78 - 105.92 |
0.1221 times |
Mon 13 October 2025 |
105.73 (0.1%) |
105.63 |
105.63 - 105.73 |
0.0949 times |
Fri 10 October 2025 |
105.62 (0.45%) |
105.51 |
105.51 - 105.66 |
0.5697 times |
Thu 09 October 2025 |
105.15 (-0.06%) |
105.14 |
105.07 - 105.15 |
0.1899 times |
Weekly price and charts GovernmentCredit Strong weekly Stock price targets for GovernmentCredit GBF are 106.05 and 106.3 | Weekly Target 1 | 105.99 | | Weekly Target 2 | 106.1 | | Weekly Target 3 | 106.24333333333 | | Weekly Target 4 | 106.35 | | Weekly Target 5 | 106.49 |
Weekly price and volumes for Government Credit
| Date |
Closing |
Open |
Range |
Volume |
Thu 23 October 2025 |
106.20 (0.12%) |
106.22 |
106.14 - 106.39 |
0.2581 times |
Fri 17 October 2025 |
106.07 (0.43%) |
105.63 |
105.63 - 106.25 |
4.5408 times |
Fri 10 October 2025 |
105.62 (0.33%) |
105.12 |
105.07 - 105.66 |
0.7195 times |
Fri 03 October 2025 |
105.27 (0.13%) |
105.39 |
105.20 - 105.56 |
0.4923 times |
Fri 26 September 2025 |
105.13 (-0.29%) |
105.29 |
105.00 - 105.46 |
1.194 times |
Fri 19 September 2025 |
105.44 (-0.26%) |
105.83 |
103.32 - 105.98 |
0.9663 times |
Fri 12 September 2025 |
105.72 (0.43%) |
105.50 |
105.33 - 105.87 |
0.5176 times |
Fri 05 September 2025 |
105.27 (0.65%) |
103.88 |
103.88 - 105.35 |
0.635 times |
Fri 29 August 2025 |
104.59 (0%) |
104.58 |
104.58 - 104.65 |
0.1656 times |
Fri 29 August 2025 |
104.59 (0.06%) |
104.35 |
104.33 - 104.69 |
0.5107 times |
Fri 22 August 2025 |
104.53 (0.39%) |
104.12 |
103.96 - 104.59 |
0.2899 times |

Monthly price and charts GovernmentCredit Strong monthly Stock price targets for GovernmentCredit GBF are 105.64 and 106.96 | Monthly Target 1 | 104.57 | | Monthly Target 2 | 105.38 | | Monthly Target 3 | 105.88666666667 | | Monthly Target 4 | 106.7 | | Monthly Target 5 | 107.21 |
Monthly price and volumes Government Credit
| Date |
Closing |
Open |
Range |
Volume |
Thu 23 October 2025 |
106.20 (0.8%) |
105.25 |
105.07 - 106.39 |
0.5038 times |
Tue 30 September 2025 |
105.36 (0.74%) |
103.88 |
103.32 - 105.98 |
0.3133 times |
Fri 29 August 2025 |
104.59 (0.74%) |
104.22 |
103.96 - 104.69 |
0.401 times |
Thu 31 July 2025 |
103.82 (-0.6%) |
103.94 |
102.84 - 104.07 |
0.9883 times |
Mon 30 June 2025 |
104.45 (1.18%) |
102.69 |
102.52 - 104.45 |
0.2903 times |
Fri 30 May 2025 |
103.23 (-1.03%) |
103.97 |
101.97 - 103.97 |
0.6883 times |
Wed 30 April 2025 |
104.30 (0.15%) |
104.20 |
100.46 - 105.24 |
0.6579 times |
Mon 31 March 2025 |
104.14 (-0.47%) |
103.94 |
103.14 - 104.52 |
0.5264 times |
Fri 28 February 2025 |
104.63 (1.93%) |
102.40 |
101.91 - 104.63 |
4.6684 times |
Fri 31 January 2025 |
102.65 (0.42%) |
102.23 |
100.99 - 102.98 |
0.9621 times |
Tue 31 December 2024 |
102.22 (-1.63%) |
104.49 |
101.74 - 104.62 |
1.09 times |

DMA SMA EMA moving averages of Government Credit GBF
DMA (daily moving average) of Government Credit GBF
| DMA period | DMA value | | 5 day DMA | 106.24 | | 12 day DMA | 105.91 | | 20 day DMA | 105.66 | | 35 day DMA | 105.6 | | 50 day DMA | 105.23 | | 100 day DMA | 104.42 | | 150 day DMA | 104.01 | | 200 day DMA | 103.76 | EMA (exponential moving average) of Government Credit GBF
| EMA period | EMA current | EMA prev | EMA prev2 | | 5 day EMA | 106.2 | 106.2 | 106.15 | | 12 day EMA | 105.98 | 105.94 | 105.87 | | 20 day EMA | 105.79 | 105.75 | 105.69 | | 35 day EMA | 105.5 | 105.46 | 105.41 | | 50 day EMA | 105.26 | 105.22 | 105.18 |
SMA (simple moving average) of Government Credit GBF
| SMA period | SMA current | SMA prev | SMA prev2 | | 5 day SMA | 106.24 | 106.24 | 106.15 | | 12 day SMA | 105.91 | 105.83 | 105.72 | | 20 day SMA | 105.66 | 105.6 | 105.55 | | 35 day SMA | 105.6 | 105.56 | 105.5 | | 50 day SMA | 105.23 | 105.19 | 105.16 | | 100 day SMA | 104.42 | 104.39 | 104.35 | | 150 day SMA | 104.01 | 104 | 103.98 | | 200 day SMA | 103.76 | 103.74 | 103.72 |
|
|
