JapaneseYen FXY full analysis,charts,indicators,moving averages,SMA,DMA,EMA,ADX,MACD,RSIJapanese Yen FXY WideScreen charts, DMA,SMA,EMA technical analysis, forecast prediction, by indicators ADX,MACD,RSI,CCI AMEX stock exchange
Daily price and charts and targets JapaneseYen Strong Daily Stock price targets for JapaneseYen FXY are 60.17 and 60.3 | Daily Target 1 | 60.13 | | Daily Target 2 | 60.2 | | Daily Target 3 | 60.26 | | Daily Target 4 | 60.33 | | Daily Target 5 | 60.39 |
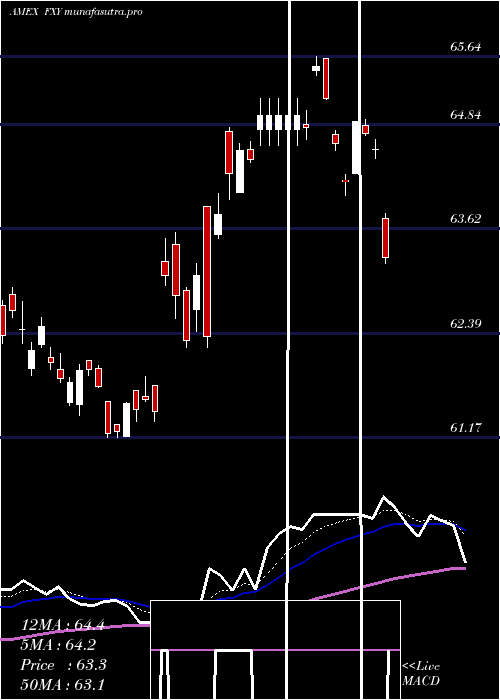
Daily price and volume Japanese Yen
| Date |
Closing |
Open |
Range |
Volume |
Thu 23 October 2025 |
60.27 (-0.43%) |
60.32 |
60.19 - 60.32 |
0.8105 times |
Wed 22 October 2025 |
60.53 (-0.07%) |
60.66 |
60.50 - 60.69 |
0.9398 times |
Tue 21 October 2025 |
60.57 (-0.74%) |
60.60 |
60.53 - 60.73 |
0.8748 times |
Mon 20 October 2025 |
61.02 (-0.21%) |
61.08 |
60.98 - 61.12 |
1.0983 times |
Fri 17 October 2025 |
61.15 (0.03%) |
61.39 |
61.07 - 61.39 |
0.9806 times |
Thu 16 October 2025 |
61.13 (0.54%) |
60.80 |
60.80 - 61.21 |
1.2953 times |
Wed 15 October 2025 |
60.80 (0.26%) |
60.69 |
60.64 - 60.89 |
0.6768 times |
Tue 14 October 2025 |
60.64 (0.4%) |
60.55 |
60.51 - 60.67 |
0.7192 times |
Mon 13 October 2025 |
60.40 (-0.46%) |
60.44 |
60.34 - 60.48 |
1.3535 times |
Fri 10 October 2025 |
60.68 (0.98%) |
60.29 |
60.26 - 60.71 |
1.2513 times |
Thu 09 October 2025 |
60.09 (-0.28%) |
60.25 |
60.03 - 60.27 |
2.2056 times |
Weekly price and charts JapaneseYen Strong weekly Stock price targets for JapaneseYen FXY are 59.77 and 60.7 | Weekly Target 1 | 59.6 | | Weekly Target 2 | 59.93 | | Weekly Target 3 | 60.526666666667 | | Weekly Target 4 | 60.86 | | Weekly Target 5 | 61.46 |
Weekly price and volumes for Japanese Yen
| Date |
Closing |
Open |
Range |
Volume |
Thu 23 October 2025 |
60.27 (-1.44%) |
61.08 |
60.19 - 61.12 |
0.6162 times |
Fri 17 October 2025 |
61.15 (0.77%) |
60.44 |
60.34 - 61.39 |
0.8317 times |
Fri 10 October 2025 |
60.68 (-2.79%) |
61.45 |
60.03 - 61.47 |
1.9652 times |
Fri 03 October 2025 |
62.42 (1.36%) |
61.88 |
61.88 - 62.74 |
1.099 times |
Fri 26 September 2025 |
61.58 (-0.98%) |
62.25 |
61.38 - 62.41 |
1.2678 times |
Fri 19 September 2025 |
62.19 (-0.26%) |
62.49 |
62.06 - 63.26 |
1.4284 times |
Fri 12 September 2025 |
62.35 (-0.08%) |
62.34 |
62.24 - 62.79 |
1.2848 times |
Fri 05 September 2025 |
62.40 (-0.37%) |
61.96 |
61.86 - 62.68 |
0.824 times |
Fri 29 August 2025 |
62.63 (0%) |
62.52 |
62.52 - 62.71 |
0.0941 times |
Fri 29 August 2025 |
62.63 (-0.02%) |
62.41 |
62.15 - 62.74 |
0.5889 times |
Fri 22 August 2025 |
62.64 (0.16%) |
62.27 |
61.91 - 62.79 |
1.5314 times |

Monthly price and charts JapaneseYen Strong monthly Stock price targets for JapaneseYen FXY are 58.8 and 61.51 | Monthly Target 1 | 58.3 | | Monthly Target 2 | 59.29 | | Monthly Target 3 | 61.013333333333 | | Monthly Target 4 | 62 | | Monthly Target 5 | 63.72 |
Monthly price and volumes Japanese Yen
| Date |
Closing |
Open |
Range |
Volume |
Thu 23 October 2025 |
60.27 (-3.12%) |
62.69 |
60.03 - 62.74 |
0.4954 times |
Tue 30 September 2025 |
62.21 (-0.67%) |
61.96 |
61.38 - 63.26 |
0.6453 times |
Fri 29 August 2025 |
62.63 (2.54%) |
62.11 |
61.91 - 62.79 |
0.6301 times |
Thu 31 July 2025 |
61.08 (-4.47%) |
64.30 |
61.03 - 64.40 |
1.3129 times |
Mon 30 June 2025 |
63.94 (-0.14%) |
64.41 |
62.46 - 64.64 |
0.6951 times |
Fri 30 May 2025 |
64.03 (-0.79%) |
63.74 |
62.01 - 64.76 |
1.3712 times |
Wed 30 April 2025 |
64.54 (4.94%) |
61.65 |
61.37 - 65.64 |
2.5895 times |
Mon 31 March 2025 |
61.50 (0.29%) |
61.13 |
61.12 - 62.93 |
0.9954 times |
Fri 28 February 2025 |
61.32 (3.11%) |
59.70 |
59.46 - 62.11 |
0.7563 times |
Fri 31 January 2025 |
59.47 (1.45%) |
58.90 |
58.25 - 59.98 |
0.5087 times |
Tue 31 December 2024 |
58.62 (-2.82%) |
62.00 |
58.39 - 62.08 |
0.4201 times |

DMA SMA EMA moving averages of Japanese Yen FXY
DMA (daily moving average) of Japanese Yen FXY
| DMA period | DMA value | | 5 day DMA | 60.71 | | 12 day DMA | 60.63 | | 20 day DMA | 61.12 | | 35 day DMA | 61.64 | | 50 day DMA | 61.86 | | 100 day DMA | 62.42 | | 150 day DMA | 62.81 | | 200 day DMA | 62.27 | EMA (exponential moving average) of Japanese Yen FXY
| EMA period | EMA current | EMA prev | EMA prev2 | | 5 day EMA | 60.58 | 60.74 | 60.84 | | 12 day EMA | 60.81 | 60.91 | 60.98 | | 20 day EMA | 61.05 | 61.13 | 61.19 | | 35 day EMA | 61.4 | 61.47 | 61.53 | | 50 day EMA | 61.79 | 61.85 | 61.9 |
SMA (simple moving average) of Japanese Yen FXY
| SMA period | SMA current | SMA prev | SMA prev2 | | 5 day SMA | 60.71 | 60.88 | 60.93 | | 12 day SMA | 60.63 | 60.65 | 60.71 | | 20 day SMA | 61.12 | 61.18 | 61.25 | | 35 day SMA | 61.64 | 61.69 | 61.73 | | 50 day SMA | 61.86 | 61.9 | 61.94 | | 100 day SMA | 62.42 | 62.45 | 62.49 | | 150 day SMA | 62.81 | 62.82 | 62.83 | | 200 day SMA | 62.27 | 62.26 | 62.25 |
|
|
