AustralianDollar FXA full analysis,charts,indicators,moving averages,SMA,DMA,EMA,ADX,MACD,RSIAustralian Dollar FXA WideScreen charts, DMA,SMA,EMA technical analysis, forecast prediction, by indicators ADX,MACD,RSI,CCI AMEX stock exchange
Daily price and charts and targets AustralianDollar Strong Daily Stock price targets for AustralianDollar FXA are 64.47 and 64.57 | Daily Target 1 | 64.39 | | Daily Target 2 | 64.44 | | Daily Target 3 | 64.49 | | Daily Target 4 | 64.54 | | Daily Target 5 | 64.59 |
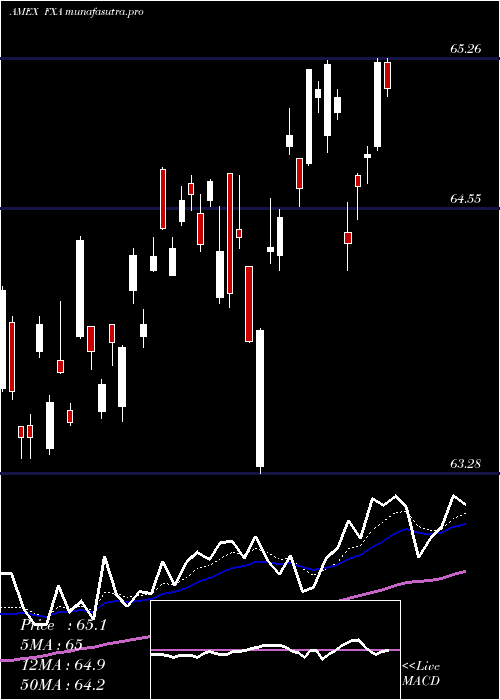
Daily price and volume Australian Dollar
| Date |
Closing |
Open |
Range |
Volume |
Thu 23 October 2025 |
64.49 (0.44%) |
64.44 |
64.44 - 64.54 |
0.2382 times |
Wed 22 October 2025 |
64.21 (-0.09%) |
64.22 |
64.21 - 64.37 |
0.4717 times |
Tue 21 October 2025 |
64.27 (-0.36%) |
64.29 |
64.25 - 64.36 |
1.0325 times |
Mon 20 October 2025 |
64.50 (0.16%) |
64.32 |
64.30 - 64.53 |
0.5767 times |
Fri 17 October 2025 |
64.40 (0.31%) |
64.13 |
64.11 - 64.40 |
2.7736 times |
Thu 16 October 2025 |
64.20 (-0.36%) |
64.31 |
64.09 - 64.31 |
0.2988 times |
Wed 15 October 2025 |
64.43 (0.37%) |
64.45 |
64.31 - 64.49 |
0.4659 times |
Tue 14 October 2025 |
64.19 (-0.5%) |
63.96 |
63.90 - 64.30 |
1.1962 times |
Mon 13 October 2025 |
64.51 (0.53%) |
64.43 |
64.43 - 64.59 |
0.6044 times |
Fri 10 October 2025 |
64.17 (-1.05%) |
64.87 |
64.17 - 64.87 |
2.342 times |
Thu 09 October 2025 |
64.85 (-0.54%) |
65.35 |
64.77 - 65.35 |
2.2161 times |
Weekly price and charts AustralianDollar Strong weekly Stock price targets for AustralianDollar FXA are 64.35 and 64.68 | Weekly Target 1 | 64.08 | | Weekly Target 2 | 64.29 | | Weekly Target 3 | 64.413333333333 | | Weekly Target 4 | 64.62 | | Weekly Target 5 | 64.74 |
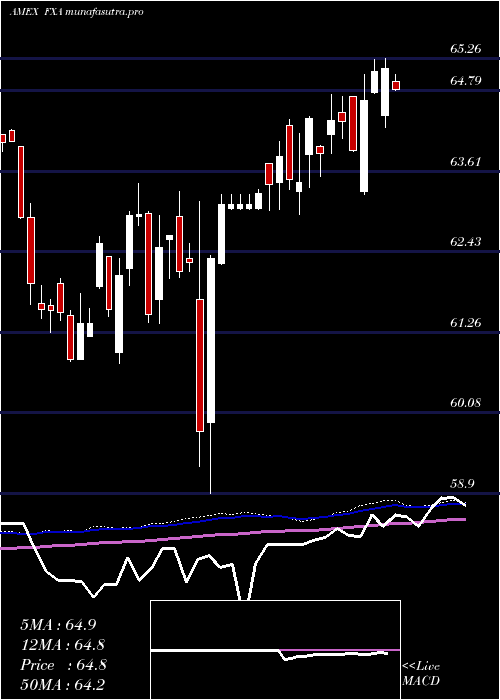
Weekly price and volumes for Australian Dollar
| Date |
Closing |
Open |
Range |
Volume |
Thu 23 October 2025 |
64.49 (0.14%) |
64.32 |
64.21 - 64.54 |
0.4009 times |
Fri 17 October 2025 |
64.40 (0.36%) |
64.43 |
63.90 - 64.59 |
0.923 times |
Fri 10 October 2025 |
64.17 (-1.82%) |
65.39 |
64.17 - 65.53 |
0.9956 times |
Fri 03 October 2025 |
65.36 (0.72%) |
65.00 |
65.00 - 65.63 |
0.6184 times |
Fri 26 September 2025 |
64.89 (-0.63%) |
65.32 |
64.69 - 65.46 |
0.8904 times |
Fri 19 September 2025 |
65.30 (-0.82%) |
65.96 |
65.25 - 66.32 |
1.8352 times |
Fri 12 September 2025 |
65.84 (1.56%) |
65.23 |
65.12 - 65.97 |
2.1835 times |
Fri 05 September 2025 |
64.83 (0%) |
64.32 |
64.32 - 65.20 |
1.3998 times |
Fri 29 August 2025 |
64.83 (0%) |
64.69 |
64.67 - 64.83 |
0.1263 times |
Fri 29 August 2025 |
64.83 (0.93%) |
64.28 |
64.11 - 64.83 |
0.627 times |
Fri 22 August 2025 |
64.23 (-0.31%) |
64.40 |
63.55 - 64.40 |
0.5355 times |
Monthly price and charts AustralianDollar Strong monthly Stock price targets for AustralianDollar FXA are 63.38 and 65.02 | Monthly Target 1 | 63 | | Monthly Target 2 | 63.75 | | Monthly Target 3 | 64.643333333333 | | Monthly Target 4 | 65.39 | | Monthly Target 5 | 66.28 |
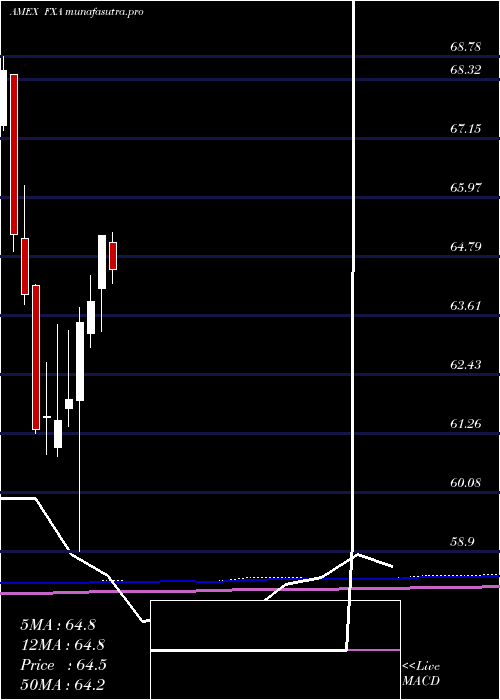
Monthly price and volumes Australian Dollar
| Date |
Closing |
Open |
Range |
Volume |
Thu 23 October 2025 |
64.49 (-1.57%) |
65.53 |
63.90 - 65.54 |
0.2613 times |
Tue 30 September 2025 |
65.52 (1.06%) |
64.32 |
64.32 - 66.32 |
0.6632 times |
Fri 29 August 2025 |
64.83 (1.87%) |
64.20 |
63.55 - 64.91 |
0.4875 times |
Thu 31 July 2025 |
63.64 (-2.41%) |
65.07 |
63.61 - 65.54 |
2.1936 times |
Mon 30 June 2025 |
65.21 (2.08%) |
64.15 |
63.28 - 65.21 |
1.2641 times |
Fri 30 May 2025 |
63.88 (0.65%) |
63.25 |
62.97 - 64.41 |
1.571 times |
Wed 30 April 2025 |
63.47 (2.5%) |
61.90 |
58.90 - 63.77 |
1.706 times |
Mon 31 March 2025 |
61.92 (0.67%) |
61.74 |
61.39 - 63.31 |
0.6841 times |
Fri 28 February 2025 |
61.51 (-0.13%) |
60.96 |
60.80 - 63.43 |
0.5883 times |
Fri 31 January 2025 |
61.59 (0.42%) |
61.58 |
60.83 - 62.66 |
0.5809 times |
Tue 31 December 2024 |
61.33 (-4.22%) |
64.20 |
61.25 - 64.22 |
0.5086 times |
DMA SMA EMA moving averages of Australian Dollar FXA
DMA (daily moving average) of Australian Dollar FXA
| DMA period | DMA value | | 5 day DMA | 64.37 | | 12 day DMA | 64.45 | | 20 day DMA | 64.78 | | 35 day DMA | 65.08 | | 50 day DMA | 64.86 | | 100 day DMA | 64.7 | | 150 day DMA | 64.12 | | 200 day DMA | 63.64 | EMA (exponential moving average) of Australian Dollar FXA
| EMA period | EMA current | EMA prev | EMA prev2 | | 5 day EMA | 64.38 | 64.32 | 64.38 | | 12 day EMA | 64.51 | 64.51 | 64.57 | | 20 day EMA | 64.65 | 64.67 | 64.72 | | 35 day EMA | 64.72 | 64.73 | 64.76 | | 50 day EMA | 64.79 | 64.8 | 64.82 |
SMA (simple moving average) of Australian Dollar FXA
| SMA period | SMA current | SMA prev | SMA prev2 | | 5 day SMA | 64.37 | 64.32 | 64.36 | | 12 day SMA | 64.45 | 64.51 | 64.61 | | 20 day SMA | 64.78 | 64.8 | 64.84 | | 35 day SMA | 65.08 | 65.08 | 65.09 | | 50 day SMA | 64.86 | 64.85 | 64.86 | | 100 day SMA | 64.7 | 64.69 | 64.69 | | 150 day SMA | 64.12 | 64.1 | 64.1 | | 200 day SMA | 63.64 | 63.62 | 63.61 |
|
|
