FidelityValue FVAL full analysis,charts,indicators,moving averages,SMA,DMA,EMA,ADX,MACD,RSIFidelity Value FVAL WideScreen charts, DMA,SMA,EMA technical analysis, forecast prediction, by indicators ADX,MACD,RSI,CCI AMEX stock exchange
Daily price and charts and targets FidelityValue Strong Daily Stock price targets for FidelityValue FVAL are 69.51 and 69.91 | Daily Target 1 | 69.2 | | Daily Target 2 | 69.42 | | Daily Target 3 | 69.6 | | Daily Target 4 | 69.82 | | Daily Target 5 | 70 |
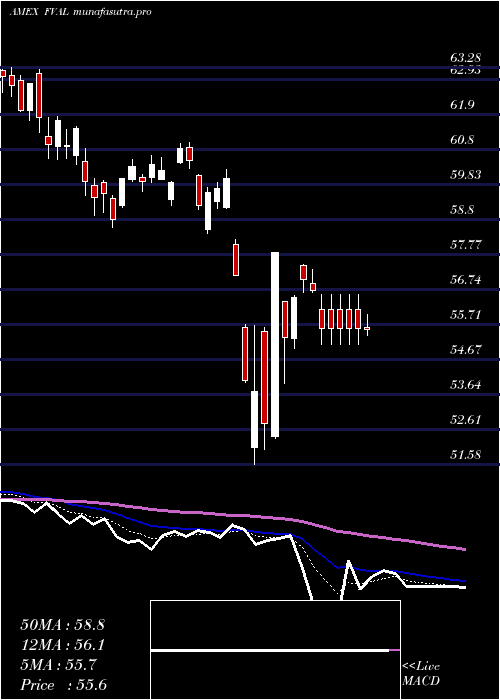
Daily price and volume Fidelity Value
| Date |
Closing |
Open |
Range |
Volume |
Thu 23 October 2025 |
69.64 (0.43%) |
69.39 |
69.38 - 69.78 |
1.6483 times |
Wed 22 October 2025 |
69.34 (-0.6%) |
69.75 |
69.02 - 69.76 |
1.3749 times |
Tue 21 October 2025 |
69.76 (0.07%) |
69.47 |
69.47 - 69.93 |
0.4848 times |
Mon 20 October 2025 |
69.71 (1.47%) |
68.99 |
68.99 - 69.75 |
0.6162 times |
Fri 17 October 2025 |
68.70 (0.67%) |
68.16 |
68.09 - 68.82 |
1.4246 times |
Thu 16 October 2025 |
68.24 (-0.63%) |
68.85 |
67.88 - 68.88 |
0.9532 times |
Wed 15 October 2025 |
68.67 (0.19%) |
68.96 |
68.18 - 69.10 |
0.9661 times |
Tue 14 October 2025 |
68.54 (0.25%) |
67.74 |
67.58 - 68.80 |
0.6941 times |
Mon 13 October 2025 |
68.37 (1.42%) |
68.10 |
67.92 - 69.00 |
0.7673 times |
Fri 10 October 2025 |
67.41 (-2.64%) |
69.38 |
67.36 - 69.49 |
1.0707 times |
Thu 09 October 2025 |
69.24 (-0.33%) |
69.57 |
69.10 - 69.58 |
0.6801 times |
Weekly price and charts FidelityValue Strong weekly Stock price targets for FidelityValue FVAL are 69.32 and 70.26 | Weekly Target 1 | 68.58 | | Weekly Target 2 | 69.11 | | Weekly Target 3 | 69.52 | | Weekly Target 4 | 70.05 | | Weekly Target 5 | 70.46 |
Weekly price and volumes for Fidelity Value
| Date |
Closing |
Open |
Range |
Volume |
Thu 23 October 2025 |
69.64 (1.37%) |
68.99 |
68.99 - 69.93 |
0.9529 times |
Fri 17 October 2025 |
68.70 (1.91%) |
68.10 |
67.58 - 69.10 |
1.1102 times |
Fri 10 October 2025 |
67.41 (-2.99%) |
69.64 |
67.36 - 69.76 |
1.092 times |
Fri 03 October 2025 |
69.49 (1.16%) |
68.82 |
68.49 - 69.76 |
0.7948 times |
Fri 26 September 2025 |
68.69 (-0.26%) |
68.70 |
67.86 - 69.36 |
1.3288 times |
Fri 19 September 2025 |
68.87 (0.54%) |
68.61 |
68.25 - 69.15 |
0.8872 times |
Fri 12 September 2025 |
68.50 (1.42%) |
67.64 |
67.35 - 68.97 |
1.5464 times |
Fri 05 September 2025 |
67.54 (0.39%) |
66.67 |
66.34 - 68.01 |
0.8373 times |
Fri 29 August 2025 |
67.28 (0%) |
67.48 |
67.22 - 67.48 |
0.3795 times |
Fri 29 August 2025 |
67.28 (-0.16%) |
67.28 |
66.97 - 67.65 |
1.0709 times |
Fri 22 August 2025 |
67.39 (1.37%) |
66.47 |
65.78 - 67.42 |
1.2289 times |

Monthly price and charts FidelityValue Strong monthly Stock price targets for FidelityValue FVAL are 68.5 and 71.07 | Monthly Target 1 | 66.41 | | Monthly Target 2 | 68.02 | | Monthly Target 3 | 68.976666666667 | | Monthly Target 4 | 70.59 | | Monthly Target 5 | 71.55 |
Monthly price and volumes Fidelity Value
| Date |
Closing |
Open |
Range |
Volume |
Thu 23 October 2025 |
69.64 (1.12%) |
68.65 |
67.36 - 69.93 |
0.3244 times |
Tue 30 September 2025 |
68.87 (2.36%) |
66.67 |
66.34 - 69.36 |
0.4446 times |
Fri 29 August 2025 |
67.28 (4.18%) |
64.19 |
63.43 - 67.65 |
0.4191 times |
Thu 31 July 2025 |
64.58 (1.11%) |
63.80 |
63.80 - 65.50 |
0.3738 times |
Mon 30 June 2025 |
63.87 (4.29%) |
61.23 |
60.85 - 63.97 |
0.5007 times |
Fri 30 May 2025 |
61.24 (5.44%) |
58.80 |
58.34 - 62.23 |
1.1473 times |
Wed 30 April 2025 |
58.08 (-2.53%) |
59.34 |
51.58 - 60.27 |
2.252 times |
Mon 31 March 2025 |
59.59 (-5.11%) |
63.10 |
58.39 - 63.24 |
2.8648 times |
Fri 28 February 2025 |
62.80 (-1.1%) |
62.40 |
61.72 - 65.00 |
0.7236 times |
Fri 31 January 2025 |
63.50 (3.22%) |
61.87 |
60.83 - 64.26 |
0.9496 times |
Tue 31 December 2024 |
61.52 (-3.8%) |
64.24 |
60.91 - 64.32 |
0.6597 times |

DMA SMA EMA moving averages of Fidelity Value FVAL
DMA (daily moving average) of Fidelity Value FVAL
| DMA period | DMA value | | 5 day DMA | 69.43 | | 12 day DMA | 68.92 | | 20 day DMA | 69.01 | | 35 day DMA | 68.74 | | 50 day DMA | 68.22 | | 100 day DMA | 66.09 | | 150 day DMA | 63.57 | | 200 day DMA | 63.3 | EMA (exponential moving average) of Fidelity Value FVAL
| EMA period | EMA current | EMA prev | EMA prev2 | | 5 day EMA | 69.38 | 69.25 | 69.21 | | 12 day EMA | 69.12 | 69.03 | 68.97 | | 20 day EMA | 68.94 | 68.87 | 68.82 | | 35 day EMA | 68.54 | 68.48 | 68.43 | | 50 day EMA | 68.16 | 68.1 | 68.05 |
SMA (simple moving average) of Fidelity Value FVAL
| SMA period | SMA current | SMA prev | SMA prev2 | | 5 day SMA | 69.43 | 69.15 | 69.02 | | 12 day SMA | 68.92 | 68.89 | 68.92 | | 20 day SMA | 69.01 | 68.94 | 68.91 | | 35 day SMA | 68.74 | 68.69 | 68.63 | | 50 day SMA | 68.22 | 68.16 | 68.11 | | 100 day SMA | 66.09 | 66.01 | 65.93 | | 150 day SMA | 63.57 | 63.51 | 63.45 | | 200 day SMA | 63.3 | 63.26 | 63.22 |
|
|
