FranklinTempleton FTF full analysis,charts,indicators,moving averages,SMA,DMA,EMA,ADX,MACD,RSIFranklin Templeton FTF WideScreen charts, DMA,SMA,EMA technical analysis, forecast prediction, by indicators ADX,MACD,RSI,CCI AMEX stock exchange
Daily price and charts and targets FranklinTempleton Strong Daily Stock price targets for FranklinTempleton FTF are 6.09 and 6.14 | Daily Target 1 | 6.07 | | Daily Target 2 | 6.1 | | Daily Target 3 | 6.1233333333333 | | Daily Target 4 | 6.15 | | Daily Target 5 | 6.17 |
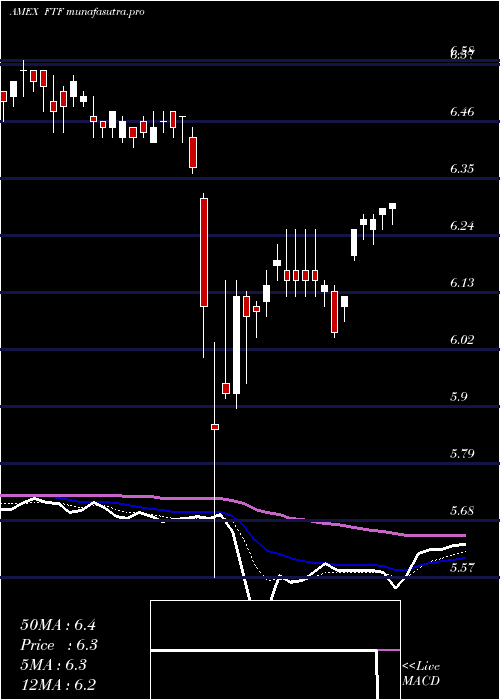
Daily price and volume Franklin Templeton
| Date |
Closing |
Open |
Range |
Volume |
Thu 23 October 2025 |
6.12 (0%) |
6.14 |
6.10 - 6.15 |
1.028 times |
Wed 22 October 2025 |
6.12 (-0.16%) |
6.05 |
5.93 - 6.15 |
1.5527 times |
Tue 21 October 2025 |
6.13 (-1.29%) |
6.20 |
6.11 - 6.23 |
3.4509 times |
Mon 20 October 2025 |
6.21 (-0.16%) |
6.26 |
6.20 - 6.26 |
0.5397 times |
Fri 17 October 2025 |
6.22 (-1.11%) |
6.24 |
6.19 - 6.25 |
0.5353 times |
Thu 16 October 2025 |
6.29 (-0.47%) |
6.32 |
6.28 - 6.46 |
0.9342 times |
Wed 15 October 2025 |
6.32 (-0.16%) |
6.33 |
6.32 - 6.35 |
0.3536 times |
Tue 14 October 2025 |
6.33 (-0.16%) |
6.34 |
6.32 - 6.34 |
0.4642 times |
Mon 13 October 2025 |
6.34 (0.32%) |
6.39 |
6.32 - 6.39 |
0.369 times |
Fri 10 October 2025 |
6.32 (-1.1%) |
6.32 |
6.30 - 6.37 |
0.7724 times |
Thu 09 October 2025 |
6.39 (-0.16%) |
6.38 |
6.37 - 6.42 |
0.4727 times |
Weekly price and charts FranklinTempleton Strong weekly Stock price targets for FranklinTempleton FTF are 5.86 and 6.19 | Weekly Target 1 | 5.77 | | Weekly Target 2 | 5.95 | | Weekly Target 3 | 6.1033333333333 | | Weekly Target 4 | 6.28 | | Weekly Target 5 | 6.43 |
Weekly price and volumes for Franklin Templeton
| Date |
Closing |
Open |
Range |
Volume |
Thu 23 October 2025 |
6.12 (-1.61%) |
6.26 |
5.93 - 6.26 |
2.5575 times |
Fri 17 October 2025 |
6.22 (-1.58%) |
6.39 |
6.19 - 6.46 |
1.0338 times |
Fri 10 October 2025 |
6.32 (-0.32%) |
6.34 |
6.16 - 6.42 |
1.1271 times |
Fri 03 October 2025 |
6.34 (-0.31%) |
6.36 |
6.33 - 6.40 |
0.9208 times |
Fri 26 September 2025 |
6.36 (-0.93%) |
6.42 |
6.35 - 6.45 |
0.779 times |
Fri 19 September 2025 |
6.42 (-0.62%) |
6.46 |
6.39 - 6.52 |
1.0134 times |
Fri 12 September 2025 |
6.46 (0.47%) |
6.41 |
6.41 - 6.47 |
0.66 times |
Fri 05 September 2025 |
6.43 (0.16%) |
6.39 |
6.39 - 6.44 |
0.6915 times |
Fri 29 August 2025 |
6.42 (0%) |
6.45 |
6.40 - 6.45 |
0.1944 times |
Fri 29 August 2025 |
6.42 (0.16%) |
6.41 |
6.38 - 6.46 |
1.0223 times |
Fri 22 August 2025 |
6.41 (-0.31%) |
6.39 |
6.35 - 6.41 |
0.8109 times |

Monthly price and charts FranklinTempleton Strong monthly Stock price targets for FranklinTempleton FTF are 5.76 and 6.29 | Monthly Target 1 | 5.64 | | Monthly Target 2 | 5.88 | | Monthly Target 3 | 6.17 | | Monthly Target 4 | 6.41 | | Monthly Target 5 | 6.7 |
Monthly price and volumes Franklin Templeton
| Date |
Closing |
Open |
Range |
Volume |
Thu 23 October 2025 |
6.12 (-3.92%) |
6.35 |
5.93 - 6.46 |
1.1997 times |
Tue 30 September 2025 |
6.37 (-0.78%) |
6.39 |
6.34 - 6.52 |
0.7876 times |
Fri 29 August 2025 |
6.42 (0.31%) |
6.36 |
6.35 - 6.46 |
0.7803 times |
Thu 31 July 2025 |
6.40 (-0.31%) |
6.43 |
6.32 - 6.55 |
1.2791 times |
Mon 30 June 2025 |
6.42 (0.31%) |
6.42 |
6.32 - 6.49 |
0.7926 times |
Fri 30 May 2025 |
6.40 (1.59%) |
6.30 |
6.28 - 6.50 |
0.7282 times |
Wed 30 April 2025 |
6.30 (-2.48%) |
6.48 |
5.57 - 6.48 |
1.2339 times |
Mon 31 March 2025 |
6.46 (-1.37%) |
6.56 |
6.41 - 6.59 |
1.0201 times |
Fri 28 February 2025 |
6.55 (-1.5%) |
6.64 |
6.52 - 6.71 |
0.847 times |
Fri 31 January 2025 |
6.65 (0.3%) |
6.65 |
6.50 - 6.68 |
1.3317 times |
Tue 31 December 2024 |
6.63 (0.91%) |
6.67 |
6.33 - 6.75 |
1.0185 times |

DMA SMA EMA moving averages of Franklin Templeton FTF
DMA (daily moving average) of Franklin Templeton FTF
| DMA period | DMA value | | 5 day DMA | 6.16 | | 12 day DMA | 6.27 | | 20 day DMA | 6.3 | | 35 day DMA | 6.36 | | 50 day DMA | 6.38 | | 100 day DMA | 6.4 | | 150 day DMA | 6.36 | | 200 day DMA | 6.42 | EMA (exponential moving average) of Franklin Templeton FTF
| EMA period | EMA current | EMA prev | EMA prev2 | | 5 day EMA | 6.17 | 6.19 | 6.22 | | 12 day EMA | 6.23 | 6.25 | 6.27 | | 20 day EMA | 6.28 | 6.3 | 6.32 | | 35 day EMA | 6.34 | 6.35 | 6.36 | | 50 day EMA | 6.35 | 6.36 | 6.37 |
SMA (simple moving average) of Franklin Templeton FTF
| SMA period | SMA current | SMA prev | SMA prev2 | | 5 day SMA | 6.16 | 6.19 | 6.23 | | 12 day SMA | 6.27 | 6.29 | 6.31 | | 20 day SMA | 6.3 | 6.32 | 6.33 | | 35 day SMA | 6.36 | 6.37 | 6.38 | | 50 day SMA | 6.38 | 6.38 | 6.39 | | 100 day SMA | 6.4 | 6.4 | 6.4 | | 150 day SMA | 6.36 | 6.37 | 6.37 | | 200 day SMA | 6.42 | 6.43 | 6.43 |
|
|
