FranklinStreet FSP full analysis,charts,indicators,moving averages,SMA,DMA,EMA,ADX,MACD,RSIFranklin Street FSP WideScreen charts, DMA,SMA,EMA technical analysis, forecast prediction, by indicators ADX,MACD,RSI,CCI AMEX stock exchange
Daily price and charts and targets FranklinStreet Strong Daily Stock price targets for FranklinStreet FSP are 1.38 and 1.41 | Daily Target 1 | 1.37 | | Daily Target 2 | 1.38 | | Daily Target 3 | 1.4 | | Daily Target 4 | 1.41 | | Daily Target 5 | 1.43 |
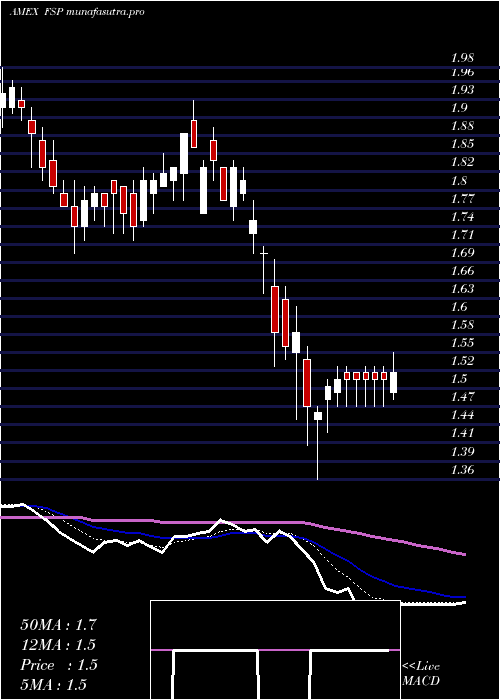
Daily price and volume Franklin Street
| Date |
Closing |
Open |
Range |
Volume |
Thu 23 October 2025 |
1.39 (-0.71%) |
1.41 |
1.39 - 1.42 |
0.5226 times |
Wed 22 October 2025 |
1.40 (-0.71%) |
1.41 |
1.38 - 1.43 |
0.7928 times |
Tue 21 October 2025 |
1.41 (-0.7%) |
1.41 |
1.41 - 1.43 |
0.5315 times |
Mon 20 October 2025 |
1.42 (2.9%) |
1.38 |
1.38 - 1.43 |
1.0951 times |
Fri 17 October 2025 |
1.38 (-2.82%) |
1.40 |
1.36 - 1.42 |
0.9175 times |
Thu 16 October 2025 |
1.42 (-2.74%) |
1.48 |
1.42 - 1.48 |
1.2563 times |
Wed 15 October 2025 |
1.46 (1.39%) |
1.47 |
1.43 - 1.49 |
1.7086 times |
Tue 14 October 2025 |
1.44 (-1.37%) |
1.45 |
1.43 - 1.47 |
0.965 times |
Mon 13 October 2025 |
1.46 (-2.67%) |
1.52 |
1.45 - 1.52 |
1.2652 times |
Fri 10 October 2025 |
1.50 (-3.23%) |
1.55 |
1.50 - 1.56 |
0.9454 times |
Thu 09 October 2025 |
1.55 (-1.27%) |
1.56 |
1.54 - 1.60 |
0.5746 times |
Weekly price and charts FranklinStreet Strong weekly Stock price targets for FranklinStreet FSP are 1.39 and 1.44 | Weekly Target 1 | 1.35 | | Weekly Target 2 | 1.37 | | Weekly Target 3 | 1.4 | | Weekly Target 4 | 1.42 | | Weekly Target 5 | 1.45 |
Weekly price and volumes for Franklin Street
| Date |
Closing |
Open |
Range |
Volume |
Thu 23 October 2025 |
1.39 (0.72%) |
1.38 |
1.38 - 1.43 |
1.2099 times |
Fri 17 October 2025 |
1.38 (-8%) |
1.52 |
1.36 - 1.52 |
2.5138 times |
Fri 10 October 2025 |
1.50 (-9.09%) |
1.64 |
1.50 - 1.70 |
1.267 times |
Fri 03 October 2025 |
1.65 (1.23%) |
1.63 |
1.58 - 1.67 |
0.8319 times |
Fri 26 September 2025 |
1.63 (0%) |
1.62 |
1.60 - 1.68 |
0.5621 times |
Fri 19 September 2025 |
1.63 (-2.98%) |
1.67 |
1.62 - 1.73 |
1.4354 times |
Fri 12 September 2025 |
1.68 (0%) |
1.68 |
1.64 - 1.73 |
0.9793 times |
Fri 05 September 2025 |
1.68 (1.2%) |
1.63 |
1.63 - 1.73 |
0.5836 times |
Fri 29 August 2025 |
1.66 (0%) |
1.66 |
1.64 - 1.67 |
0.0619 times |
Fri 29 August 2025 |
1.66 (-2.92%) |
1.71 |
1.63 - 1.74 |
0.5552 times |
Fri 22 August 2025 |
1.71 (6.87%) |
1.59 |
1.59 - 1.73 |
1.0504 times |

Monthly price and charts FranklinStreet Strong monthly Stock price targets for FranklinStreet FSP are 1.21 and 1.55 | Monthly Target 1 | 1.14 | | Monthly Target 2 | 1.27 | | Monthly Target 3 | 1.4833333333333 | | Monthly Target 4 | 1.61 | | Monthly Target 5 | 1.82 |
Monthly price and volumes Franklin Street
| Date |
Closing |
Open |
Range |
Volume |
Thu 23 October 2025 |
1.39 (-13.13%) |
1.60 |
1.36 - 1.70 |
1.3378 times |
Tue 30 September 2025 |
1.60 (-3.61%) |
1.63 |
1.58 - 1.73 |
0.9332 times |
Fri 29 August 2025 |
1.66 (0.61%) |
1.65 |
1.55 - 1.74 |
0.781 times |
Thu 31 July 2025 |
1.65 (0.61%) |
1.64 |
1.61 - 1.82 |
1.1441 times |
Mon 30 June 2025 |
1.64 (-9.89%) |
1.81 |
1.64 - 1.84 |
1.1228 times |
Fri 30 May 2025 |
1.82 (15.19%) |
1.54 |
1.45 - 2.05 |
1.4284 times |
Wed 30 April 2025 |
1.58 (-11.24%) |
1.77 |
1.36 - 1.84 |
1.0658 times |
Mon 31 March 2025 |
1.78 (-5.32%) |
1.87 |
1.70 - 1.93 |
0.9318 times |
Fri 28 February 2025 |
1.88 (3.87%) |
1.75 |
1.75 - 2.09 |
0.5767 times |
Fri 31 January 2025 |
1.81 (-1.09%) |
1.82 |
1.69 - 1.90 |
0.6786 times |
Tue 31 December 2024 |
1.83 (-5.67%) |
1.91 |
1.77 - 2.21 |
1.0923 times |

DMA SMA EMA moving averages of Franklin Street FSP
DMA (daily moving average) of Franklin Street FSP
| DMA period | DMA value | | 5 day DMA | 1.4 | | 12 day DMA | 1.45 | | 20 day DMA | 1.52 | | 35 day DMA | 1.58 | | 50 day DMA | 1.6 | | 100 day DMA | 1.65 | | 150 day DMA | 1.65 | | 200 day DMA | 1.69 | EMA (exponential moving average) of Franklin Street FSP
| EMA period | EMA current | EMA prev | EMA prev2 | | 5 day EMA | 1.4 | 1.41 | 1.42 | | 12 day EMA | 1.45 | 1.46 | 1.47 | | 20 day EMA | 1.5 | 1.51 | 1.52 | | 35 day EMA | 1.54 | 1.55 | 1.56 | | 50 day EMA | 1.57 | 1.58 | 1.59 |
SMA (simple moving average) of Franklin Street FSP
| SMA period | SMA current | SMA prev | SMA prev2 | | 5 day SMA | 1.4 | 1.41 | 1.42 | | 12 day SMA | 1.45 | 1.47 | 1.48 | | 20 day SMA | 1.52 | 1.53 | 1.54 | | 35 day SMA | 1.58 | 1.58 | 1.59 | | 50 day SMA | 1.6 | 1.6 | 1.61 | | 100 day SMA | 1.65 | 1.65 | 1.65 | | 150 day SMA | 1.65 | 1.65 | 1.65 | | 200 day SMA | 1.69 | 1.7 | 1.7 |
|
|
