ShortDuration FSMB full analysis,charts,indicators,moving averages,SMA,DMA,EMA,ADX,MACD,RSIShort Duration FSMB WideScreen charts, DMA,SMA,EMA technical analysis, forecast prediction, by indicators ADX,MACD,RSI,CCI AMEX stock exchange
Daily price and charts and targets ShortDuration Strong Daily Stock price targets for ShortDuration FSMB are 20.03 and 20.08 | Daily Target 1 | 20.02 | | Daily Target 2 | 20.04 | | Daily Target 3 | 20.07 | | Daily Target 4 | 20.09 | | Daily Target 5 | 20.12 |
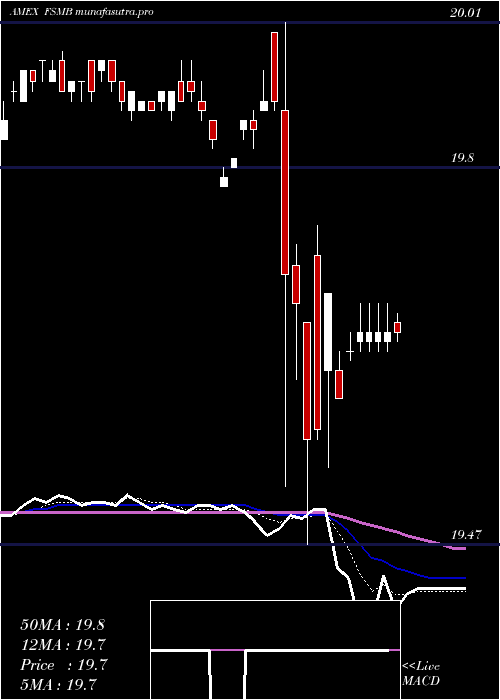
Daily price and volume Short Duration
| Date |
Closing |
Open |
Range |
Volume |
Thu 23 October 2025 |
20.06 (-0.05%) |
20.10 |
20.05 - 20.10 |
1.0918 times |
Wed 22 October 2025 |
20.07 (-0.05%) |
20.07 |
20.06 - 20.07 |
0.7341 times |
Tue 21 October 2025 |
20.08 (-0.1%) |
20.05 |
20.05 - 20.10 |
0.9224 times |
Mon 20 October 2025 |
20.10 (-0.1%) |
20.17 |
20.01 - 20.17 |
0.8932 times |
Fri 17 October 2025 |
20.12 (0%) |
20.12 |
20.11 - 20.13 |
0.6651 times |
Thu 16 October 2025 |
20.12 (0.25%) |
20.11 |
20.08 - 20.12 |
0.9641 times |
Wed 15 October 2025 |
20.07 (-0.2%) |
20.15 |
20.07 - 20.15 |
1.0997 times |
Tue 14 October 2025 |
20.11 (0.1%) |
20.11 |
20.10 - 20.11 |
0.1113 times |
Mon 13 October 2025 |
20.09 (0.05%) |
20.14 |
20.06 - 20.14 |
0.499 times |
Tue 07 October 2025 |
20.08 (-0.05%) |
20.11 |
20.07 - 20.11 |
3.0193 times |
Mon 06 October 2025 |
20.09 (0.05%) |
20.07 |
20.07 - 20.09 |
0.7474 times |
Weekly price and charts ShortDuration Strong weekly Stock price targets for ShortDuration FSMB are 19.96 and 20.12 | Weekly Target 1 | 19.92 | | Weekly Target 2 | 19.99 | | Weekly Target 3 | 20.08 | | Weekly Target 4 | 20.15 | | Weekly Target 5 | 20.24 |
Weekly price and volumes for Short Duration
| Date |
Closing |
Open |
Range |
Volume |
Thu 23 October 2025 |
20.06 (-0.3%) |
20.17 |
20.01 - 20.17 |
1.1587 times |
Fri 17 October 2025 |
20.12 (0.2%) |
20.14 |
20.06 - 20.15 |
1.0625 times |
Tue 07 October 2025 |
20.08 (0%) |
20.07 |
20.07 - 20.11 |
1.1985 times |
Fri 03 October 2025 |
20.08 (0%) |
20.08 |
20.00 - 20.10 |
1.3956 times |
Fri 26 September 2025 |
20.08 (-0.54%) |
20.19 |
20.04 - 20.19 |
0.8891 times |
Fri 19 September 2025 |
20.19 (0.1%) |
20.18 |
20.13 - 20.21 |
1.3906 times |
Fri 12 September 2025 |
20.17 (0.4%) |
20.09 |
20.09 - 20.17 |
0.9806 times |
Fri 05 September 2025 |
20.09 (0.35%) |
20.02 |
20.00 - 20.09 |
0.7541 times |
Fri 29 August 2025 |
20.02 (0%) |
20.01 |
20.00 - 20.04 |
0.2246 times |
Fri 29 August 2025 |
20.02 (0.1%) |
19.99 |
19.96 - 20.04 |
0.9458 times |
Fri 22 August 2025 |
20.00 (0%) |
20.03 |
19.96 - 20.04 |
1.2014 times |

Monthly price and charts ShortDuration Strong monthly Stock price targets for ShortDuration FSMB are 19.95 and 20.12 | Monthly Target 1 | 19.91 | | Monthly Target 2 | 19.98 | | Monthly Target 3 | 20.076666666667 | | Monthly Target 4 | 20.15 | | Monthly Target 5 | 20.25 |
Monthly price and volumes Short Duration
| Date |
Closing |
Open |
Range |
Volume |
Thu 23 October 2025 |
20.06 (-0.1%) |
20.09 |
20.00 - 20.17 |
0.7945 times |
Tue 30 September 2025 |
20.08 (0.3%) |
20.02 |
20.00 - 20.21 |
0.8024 times |
Fri 29 August 2025 |
20.02 (0.4%) |
19.97 |
19.96 - 20.04 |
0.8377 times |
Thu 31 July 2025 |
19.94 (0.15%) |
19.94 |
19.85 - 19.98 |
1.0178 times |
Mon 30 June 2025 |
19.91 (0.45%) |
19.83 |
19.81 - 19.95 |
0.7175 times |
Fri 30 May 2025 |
19.82 (0.3%) |
19.79 |
19.74 - 19.83 |
1.0771 times |
Wed 30 April 2025 |
19.76 (-0.55%) |
19.90 |
19.47 - 20.01 |
1.6086 times |
Mon 31 March 2025 |
19.87 (-0.5%) |
19.95 |
19.84 - 19.98 |
0.9374 times |
Fri 28 February 2025 |
19.97 (0.3%) |
19.97 |
19.87 - 19.98 |
0.7557 times |
Fri 31 January 2025 |
19.91 (0.35%) |
19.84 |
19.78 - 19.97 |
1.4513 times |
Tue 31 December 2024 |
19.84 (-0.5%) |
20.02 |
19.77 - 20.02 |
0.933 times |

DMA SMA EMA moving averages of Short Duration FSMB
DMA (daily moving average) of Short Duration FSMB
| DMA period | DMA value | | 5 day DMA | 20.09 | | 12 day DMA | 20.09 | | 20 day DMA | 20.09 | | 35 day DMA | 20.11 | | 50 day DMA | 20.08 | | 100 day DMA | 19.99 | | 150 day DMA | 19.92 | | 200 day DMA | 19.92 | EMA (exponential moving average) of Short Duration FSMB
| EMA period | EMA current | EMA prev | EMA prev2 | | 5 day EMA | 20.08 | 20.09 | 20.1 | | 12 day EMA | 20.09 | 20.1 | 20.1 | | 20 day EMA | 20.11 | 20.12 | 20.12 | | 35 day EMA | 20.07 | 20.07 | 20.07 | | 50 day EMA | 20.07 | 20.07 | 20.07 |
SMA (simple moving average) of Short Duration FSMB
| SMA period | SMA current | SMA prev | SMA prev2 | | 5 day SMA | 20.09 | 20.1 | 20.1 | | 12 day SMA | 20.09 | 20.09 | 20.09 | | 20 day SMA | 20.09 | 20.1 | 20.11 | | 35 day SMA | 20.11 | 20.11 | 20.11 | | 50 day SMA | 20.08 | 20.08 | 20.08 | | 100 day SMA | 19.99 | 19.99 | 19.99 | | 150 day SMA | 19.92 | 19.92 | 19.92 | | 200 day SMA | 19.92 | 19.92 | 19.92 |
|
|
