FlexibleSolutions FSI full analysis,charts,indicators,moving averages,SMA,DMA,EMA,ADX,MACD,RSIFlexible Solutions FSI WideScreen charts, DMA,SMA,EMA technical analysis, forecast prediction, by indicators ADX,MACD,RSI,CCI AMEX stock exchange
Daily price and charts and targets FlexibleSolutions Strong Daily Stock price targets for FlexibleSolutions FSI are 8.85 and 9.85 | Daily Target 1 | 8.05 | | Daily Target 2 | 8.65 | | Daily Target 3 | 9.0466666666667 | | Daily Target 4 | 9.65 | | Daily Target 5 | 10.05 |
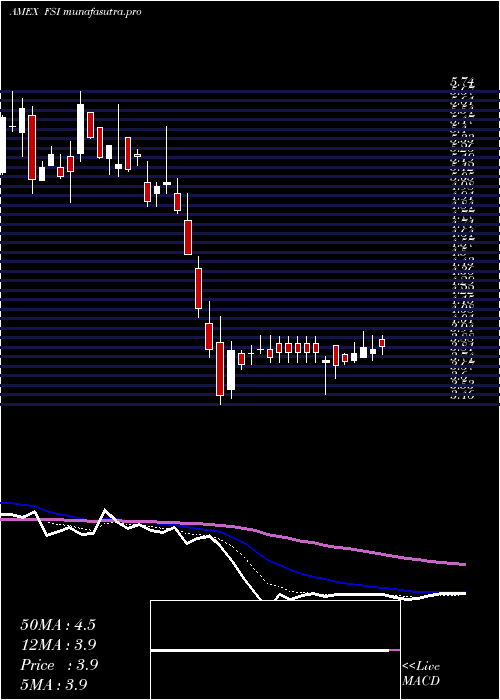
Daily price and volume Flexible Solutions
| Date |
Closing |
Open |
Range |
Volume |
Thu 23 October 2025 |
9.26 (11.03%) |
8.44 |
8.44 - 9.44 |
1.2242 times |
Wed 22 October 2025 |
8.34 (-2.68%) |
8.63 |
8.34 - 8.70 |
0.3444 times |
Tue 21 October 2025 |
8.57 (-3.05%) |
8.71 |
8.57 - 9.03 |
0.5107 times |
Mon 20 October 2025 |
8.84 (-1.78%) |
9.28 |
8.70 - 9.28 |
0.5665 times |
Fri 17 October 2025 |
9.00 (1.81%) |
8.65 |
8.42 - 9.08 |
1.3151 times |
Thu 16 October 2025 |
8.84 (-3.28%) |
9.31 |
8.64 - 9.41 |
1.0157 times |
Wed 15 October 2025 |
9.14 (1.67%) |
8.96 |
8.83 - 9.36 |
1.1337 times |
Tue 14 October 2025 |
8.99 (2.04%) |
8.76 |
8.53 - 9.10 |
0.7859 times |
Mon 13 October 2025 |
8.81 (4.01%) |
8.69 |
8.40 - 9.08 |
1.8337 times |
Fri 10 October 2025 |
8.47 (-4.83%) |
9.05 |
8.31 - 9.29 |
1.2701 times |
Thu 09 October 2025 |
8.90 (-2.63%) |
9.25 |
8.20 - 9.25 |
2.8242 times |
Weekly price and charts FlexibleSolutions Strong weekly Stock price targets for FlexibleSolutions FSI are 8.25 and 9.35 | Weekly Target 1 | 7.91 | | Weekly Target 2 | 8.59 | | Weekly Target 3 | 9.0133333333333 | | Weekly Target 4 | 9.69 | | Weekly Target 5 | 10.11 |
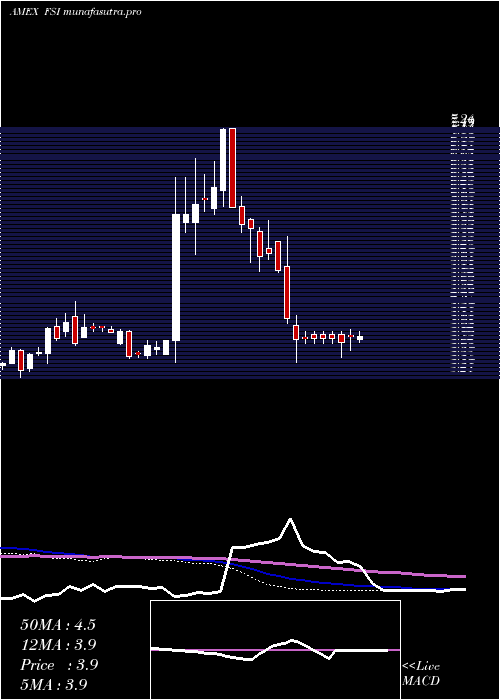
Weekly price and volumes for Flexible Solutions
| Date |
Closing |
Open |
Range |
Volume |
Thu 23 October 2025 |
9.26 (2.89%) |
9.28 |
8.34 - 9.44 |
0.3118 times |
Fri 17 October 2025 |
9.00 (6.26%) |
8.69 |
8.40 - 9.41 |
0.7169 times |
Fri 10 October 2025 |
8.47 (-9.89%) |
9.34 |
8.20 - 9.61 |
0.8276 times |
Fri 03 October 2025 |
9.40 (-1.16%) |
9.28 |
8.93 - 10.50 |
1.082 times |
Fri 26 September 2025 |
9.51 (-4.8%) |
9.99 |
9.22 - 11.30 |
0.6801 times |
Fri 19 September 2025 |
9.99 (2.57%) |
9.86 |
9.66 - 11.07 |
1.0482 times |
Fri 12 September 2025 |
9.74 (2.53%) |
9.50 |
9.19 - 9.98 |
0.7019 times |
Fri 05 September 2025 |
9.50 (-15.56%) |
10.55 |
8.75 - 10.55 |
1.645 times |
Fri 29 August 2025 |
11.25 (0%) |
11.11 |
10.92 - 11.48 |
0.593 times |
Fri 29 August 2025 |
11.25 (49.8%) |
7.82 |
7.78 - 11.48 |
2.3936 times |
Fri 22 August 2025 |
7.51 (0.13%) |
7.78 |
7.50 - 8.43 |
0.6062 times |
Monthly price and charts FlexibleSolutions Strong monthly Stock price targets for FlexibleSolutions FSI are 7.58 and 9.88 | Monthly Target 1 | 7.02 | | Monthly Target 2 | 8.14 | | Monthly Target 3 | 9.32 | | Monthly Target 4 | 10.44 | | Monthly Target 5 | 11.62 |
Monthly price and volumes Flexible Solutions
| Date |
Closing |
Open |
Range |
Volume |
Thu 23 October 2025 |
9.26 (-3.94%) |
9.70 |
8.20 - 10.50 |
0.293 times |
Tue 30 September 2025 |
9.64 (-14.31%) |
10.55 |
8.75 - 11.30 |
0.5227 times |
Fri 29 August 2025 |
11.25 (111.07%) |
5.30 |
5.11 - 11.48 |
0.6436 times |
Thu 31 July 2025 |
5.33 (9.9%) |
4.82 |
4.61 - 6.10 |
0.2125 times |
Mon 30 June 2025 |
4.85 (9.98%) |
4.46 |
4.21 - 5.00 |
0.0876 times |
Fri 30 May 2025 |
4.41 (16.98%) |
3.81 |
3.55 - 5.09 |
0.1848 times |
Wed 30 April 2025 |
3.77 (-25.35%) |
5.06 |
3.46 - 5.49 |
0.3261 times |
Mon 31 March 2025 |
5.05 (-11.25%) |
5.76 |
4.90 - 5.78 |
0.1787 times |
Fri 28 February 2025 |
5.69 (-6.41%) |
5.94 |
5.55 - 7.24 |
0.4648 times |
Fri 31 January 2025 |
6.08 (68.42%) |
3.78 |
3.45 - 6.75 |
7.0862 times |
Tue 31 December 2024 |
3.61 (-9.98%) |
3.99 |
3.51 - 4.03 |
0.1243 times |

DMA SMA EMA moving averages of Flexible Solutions FSI
DMA (daily moving average) of Flexible Solutions FSI
| DMA period | DMA value | | 5 day DMA | 8.8 | | 12 day DMA | 8.86 | | 20 day DMA | 9.11 | | 35 day DMA | 9.45 | | 50 day DMA | 9.35 | | 100 day DMA | 7.28 | | 150 day DMA | 6.25 | | 200 day DMA | 6.11 | EMA (exponential moving average) of Flexible Solutions FSI
| EMA period | EMA current | EMA prev | EMA prev2 | | 5 day EMA | 8.85 | 8.65 | 8.8 | | 12 day EMA | 8.94 | 8.88 | 8.98 | | 20 day EMA | 9.04 | 9.02 | 9.09 | | 35 day EMA | 9.03 | 9.02 | 9.06 | | 50 day EMA | 9.07 | 9.06 | 9.09 |
SMA (simple moving average) of Flexible Solutions FSI
| SMA period | SMA current | SMA prev | SMA prev2 | | 5 day SMA | 8.8 | 8.72 | 8.88 | | 12 day SMA | 8.86 | 8.84 | 8.92 | | 20 day SMA | 9.11 | 9.13 | 9.21 | | 35 day SMA | 9.45 | 9.47 | 9.51 | | 50 day SMA | 9.35 | 9.31 | 9.29 | | 100 day SMA | 7.28 | 7.24 | 7.19 | | 150 day SMA | 6.25 | 6.22 | 6.2 | | 200 day SMA | 6.11 | 6.08 | 6.06 |
|
|
