UsIpo FPX full analysis,charts,indicators,moving averages,SMA,DMA,EMA,ADX,MACD,RSIUs Ipo FPX WideScreen charts, DMA,SMA,EMA technical analysis, forecast prediction, by indicators ADX,MACD,RSI,CCI AMEX stock exchange
Daily price and charts and targets UsIpo Strong Daily Stock price targets for UsIpo FPX are 161.84 and 165.99 | Daily Target 1 | 158.45 | | Daily Target 2 | 161.07 | | Daily Target 3 | 162.59666666667 | | Daily Target 4 | 165.22 | | Daily Target 5 | 166.75 |
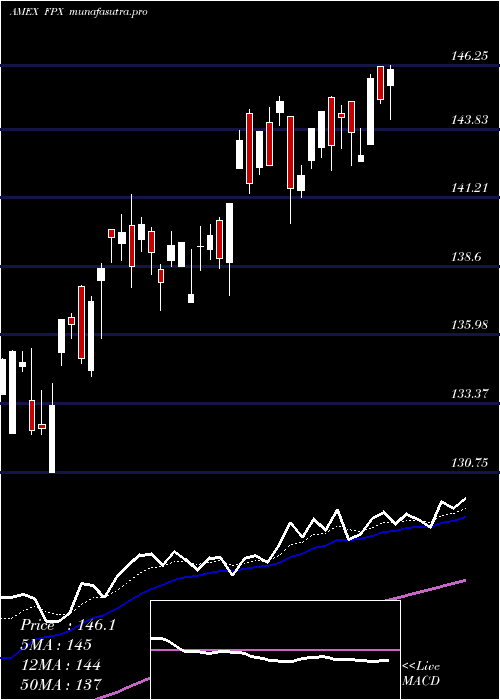
Daily price and volume Us Ipo
| Date |
Closing |
Open |
Range |
Volume |
Thu 23 October 2025 |
163.70 (2.27%) |
159.97 |
159.97 - 164.12 |
0.5725 times |
Wed 22 October 2025 |
160.06 (-1.52%) |
162.81 |
157.70 - 163.06 |
0.6576 times |
Tue 21 October 2025 |
162.53 (-0.73%) |
163.28 |
161.93 - 163.51 |
0.5104 times |
Mon 20 October 2025 |
163.72 (0.18%) |
165.13 |
163.49 - 165.13 |
0.6479 times |
Fri 17 October 2025 |
163.43 (-0.37%) |
162.47 |
161.41 - 164.77 |
2.8324 times |
Thu 16 October 2025 |
164.04 (-1.75%) |
168.09 |
163.48 - 168.11 |
0.7519 times |
Wed 15 October 2025 |
166.96 (0.8%) |
167.94 |
164.81 - 169.38 |
1.6206 times |
Tue 14 October 2025 |
165.63 (0.04%) |
162.86 |
161.21 - 167.19 |
0.8867 times |
Mon 13 October 2025 |
165.57 (2.9%) |
164.38 |
163.50 - 165.67 |
0.5216 times |
Fri 10 October 2025 |
160.90 (-3.69%) |
167.40 |
160.90 - 167.84 |
0.9984 times |
Thu 09 October 2025 |
167.07 (-0.29%) |
166.89 |
165.74 - 167.78 |
0.6296 times |
Weekly price and charts UsIpo Strong weekly Stock price targets for UsIpo FPX are 156.99 and 164.42 | Weekly Target 1 | 154.75 | | Weekly Target 2 | 159.22 | | Weekly Target 3 | 162.17666666667 | | Weekly Target 4 | 166.65 | | Weekly Target 5 | 169.61 |
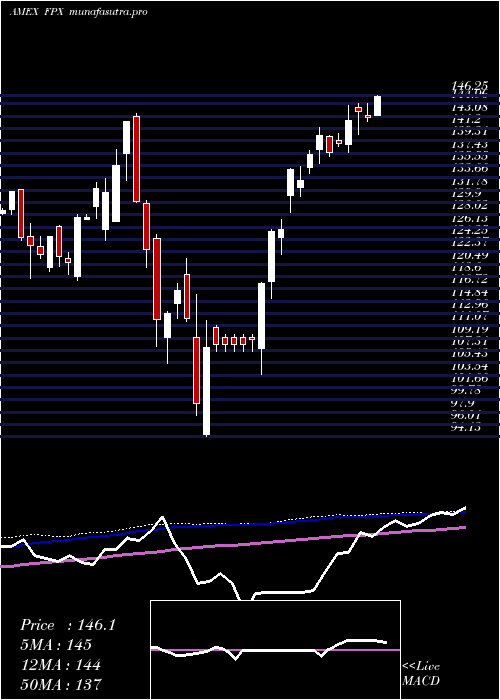
Weekly price and volumes for Us Ipo
| Date |
Closing |
Open |
Range |
Volume |
Thu 23 October 2025 |
163.70 (0.17%) |
165.13 |
157.70 - 165.13 |
0.4622 times |
Fri 17 October 2025 |
163.43 (1.57%) |
164.38 |
161.21 - 169.38 |
1.2797 times |
Fri 10 October 2025 |
160.90 (-2.9%) |
167.00 |
160.90 - 167.84 |
1.4265 times |
Fri 03 October 2025 |
165.71 (1.72%) |
164.92 |
164.30 - 167.77 |
0.9156 times |
Fri 26 September 2025 |
162.90 (-1.06%) |
164.41 |
159.20 - 167.04 |
1.4015 times |
Fri 19 September 2025 |
164.64 (3.71%) |
159.67 |
157.42 - 165.08 |
1.369 times |
Fri 12 September 2025 |
158.75 (5.27%) |
152.70 |
152.63 - 159.62 |
0.9552 times |
Fri 05 September 2025 |
150.80 (0%) |
147.48 |
146.75 - 152.49 |
0.7584 times |
Fri 29 August 2025 |
150.80 (0%) |
152.82 |
150.07 - 152.82 |
0.1182 times |
Fri 29 August 2025 |
150.80 (0.89%) |
149.74 |
148.99 - 153.55 |
1.3135 times |
Fri 22 August 2025 |
149.47 (-1%) |
150.44 |
142.97 - 151.59 |
1.1095 times |
Monthly price and charts UsIpo Strong monthly Stock price targets for UsIpo FPX are 154.86 and 166.54 | Monthly Target 1 | 151.91 | | Monthly Target 2 | 157.81 | | Monthly Target 3 | 163.59333333333 | | Monthly Target 4 | 169.49 | | Monthly Target 5 | 175.27 |
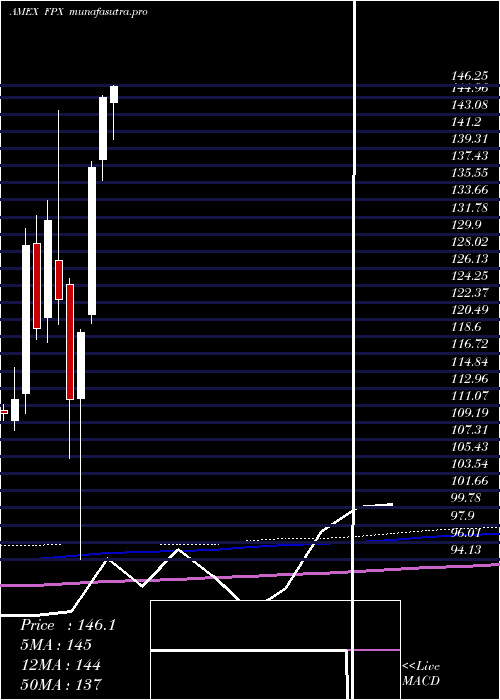
Monthly price and volumes Us Ipo
| Date |
Closing |
Open |
Range |
Volume |
Thu 23 October 2025 |
163.70 (-1.48%) |
164.47 |
157.70 - 169.38 |
0.8837 times |
Tue 30 September 2025 |
166.16 (10.19%) |
147.48 |
146.75 - 167.04 |
1.1588 times |
Fri 29 August 2025 |
150.80 (-0.93%) |
148.97 |
142.97 - 156.29 |
1.252 times |
Thu 31 July 2025 |
152.22 (5.04%) |
144.34 |
140.26 - 154.12 |
0.8703 times |
Mon 30 June 2025 |
144.91 (5.56%) |
138.06 |
135.85 - 145.10 |
0.8284 times |
Fri 30 May 2025 |
137.28 (15.3%) |
121.08 |
120.03 - 137.86 |
0.7479 times |
Wed 30 April 2025 |
119.06 (6.55%) |
111.86 |
94.13 - 119.45 |
1.0067 times |
Mon 31 March 2025 |
111.74 (-8.92%) |
124.35 |
105.28 - 125.05 |
1.1626 times |
Fri 28 February 2025 |
122.68 (-6.65%) |
127.04 |
119.98 - 143.53 |
1.3309 times |
Fri 31 January 2025 |
131.42 (9.97%) |
120.76 |
118.01 - 133.55 |
0.7587 times |
Tue 31 December 2024 |
119.51 (-7.08%) |
128.90 |
118.33 - 131.94 |
0.6477 times |
DMA SMA EMA moving averages of Us Ipo FPX
DMA (daily moving average) of Us Ipo FPX
| DMA period | DMA value | | 5 day DMA | 162.69 | | 12 day DMA | 164.26 | | 20 day DMA | 164.77 | | 35 day DMA | 162.7 | | 50 day DMA | 158.85 | | 100 day DMA | 152.08 | | 150 day DMA | 141.15 | | 200 day DMA | 137.28 | EMA (exponential moving average) of Us Ipo FPX
| EMA period | EMA current | EMA prev | EMA prev2 | | 5 day EMA | 162.9 | 162.5 | 163.72 | | 12 day EMA | 163.66 | 163.65 | 164.3 | | 20 day EMA | 163.46 | 163.43 | 163.79 | | 35 day EMA | 161.33 | 161.19 | 161.26 | | 50 day EMA | 158.79 | 158.59 | 158.53 |
SMA (simple moving average) of Us Ipo FPX
| SMA period | SMA current | SMA prev | SMA prev2 | | 5 day SMA | 162.69 | 162.76 | 164.14 | | 12 day SMA | 164.26 | 164.4 | 164.81 | | 20 day SMA | 164.77 | 164.66 | 164.85 | | 35 day SMA | 162.7 | 162.33 | 162.03 | | 50 day SMA | 158.85 | 158.6 | 158.48 | | 100 day SMA | 152.08 | 151.81 | 151.56 | | 150 day SMA | 141.15 | 140.83 | 140.53 | | 200 day SMA | 137.28 | 137.07 | 136.88 |
|
|
