MicrosectorsFang FNGS full analysis,charts,indicators,moving averages,SMA,DMA,EMA,ADX,MACD,RSIMicrosectors Fang FNGS WideScreen charts, DMA,SMA,EMA technical analysis, forecast prediction, by indicators ADX,MACD,RSI,CCI AMEX stock exchange
Daily price and charts and targets MicrosectorsFang Strong Daily Stock price targets for MicrosectorsFang FNGS are 70.05 and 70.78 | Daily Target 1 | 69.47 | | Daily Target 2 | 69.9 | | Daily Target 3 | 70.196666666667 | | Daily Target 4 | 70.63 | | Daily Target 5 | 70.93 |
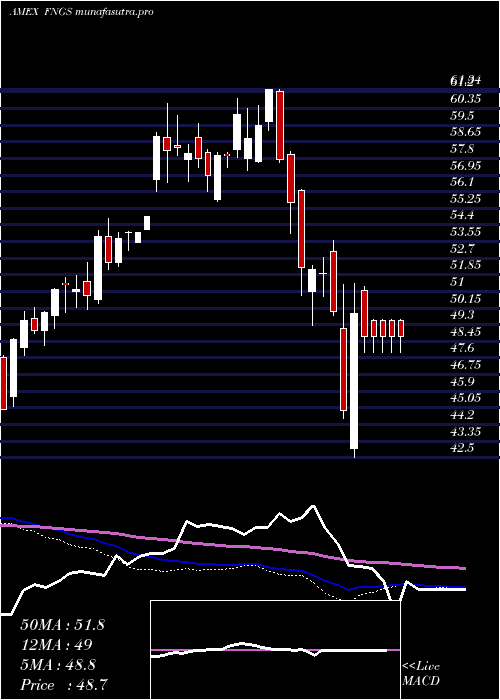
Daily price and volume Microsectors Fang
| Date |
Closing |
Open |
Range |
Volume |
Thu 23 October 2025 |
70.34 (0.82%) |
69.76 |
69.76 - 70.49 |
0.161 times |
Wed 22 October 2025 |
69.77 (-1.61%) |
70.56 |
69.11 - 70.94 |
1.3202 times |
Tue 21 October 2025 |
70.91 (0.28%) |
70.98 |
70.58 - 70.98 |
0.5674 times |
Mon 20 October 2025 |
70.71 (1.9%) |
69.80 |
69.79 - 70.86 |
0.3036 times |
Fri 17 October 2025 |
69.39 (0.55%) |
68.52 |
68.50 - 70.50 |
0.3906 times |
Thu 16 October 2025 |
69.01 (-0.52%) |
70.09 |
68.47 - 70.19 |
4.0161 times |
Wed 15 October 2025 |
69.37 (0.32%) |
69.90 |
68.94 - 70.21 |
0.333 times |
Tue 14 October 2025 |
69.15 (-2.18%) |
69.34 |
68.51 - 69.88 |
0.8058 times |
Mon 13 October 2025 |
70.69 (3.35%) |
69.94 |
69.35 - 70.69 |
0.7945 times |
Fri 10 October 2025 |
68.40 (-3.68%) |
71.10 |
68.00 - 71.30 |
1.3078 times |
Thu 09 October 2025 |
71.01 (0.61%) |
70.79 |
70.36 - 71.01 |
0.5488 times |

Weekly price and charts MicrosectorsFang Strong weekly Stock price targets for MicrosectorsFang FNGS are 69.73 and 71.6 | Weekly Target 1 | 68.27 | | Weekly Target 2 | 69.31 | | Weekly Target 3 | 70.143333333333 | | Weekly Target 4 | 71.18 | | Weekly Target 5 | 72.01 |
Weekly price and volumes for Microsectors Fang
| Date |
Closing |
Open |
Range |
Volume |
Thu 23 October 2025 |
70.34 (1.37%) |
69.80 |
69.11 - 70.98 |
0.6167 times |
Fri 17 October 2025 |
69.39 (1.45%) |
69.94 |
68.47 - 70.69 |
1.6623 times |
Fri 10 October 2025 |
68.40 (-1.53%) |
69.51 |
68.00 - 71.30 |
0.9704 times |
Fri 03 October 2025 |
69.46 (-0.5%) |
70.40 |
69.00 - 70.60 |
0.9654 times |
Fri 26 September 2025 |
69.81 (-1.92%) |
71.18 |
68.69 - 71.69 |
0.9208 times |
Fri 19 September 2025 |
71.18 (2.74%) |
69.76 |
68.96 - 71.23 |
1.9297 times |
Fri 12 September 2025 |
69.28 (1.75%) |
68.68 |
68.33 - 69.85 |
0.914 times |
Fri 05 September 2025 |
68.09 (3.12%) |
64.79 |
64.44 - 68.63 |
0.9503 times |
Fri 29 August 2025 |
66.03 (0%) |
67.00 |
65.68 - 67.00 |
0.2117 times |
Fri 29 August 2025 |
66.03 (0.43%) |
65.79 |
65.31 - 67.33 |
0.8587 times |
Fri 22 August 2025 |
65.75 (-1.73%) |
66.37 |
64.07 - 67.01 |
2.2262 times |
Monthly price and charts MicrosectorsFang Strong monthly Stock price targets for MicrosectorsFang FNGS are 69.17 and 72.47 | Monthly Target 1 | 66.58 | | Monthly Target 2 | 68.46 | | Monthly Target 3 | 69.88 | | Monthly Target 4 | 71.76 | | Monthly Target 5 | 73.18 |
Monthly price and volumes Microsectors Fang
| Date |
Closing |
Open |
Range |
Volume |
Thu 23 October 2025 |
70.34 (0.51%) |
69.89 |
68.00 - 71.30 |
0.6186 times |
Tue 30 September 2025 |
69.98 (5.98%) |
64.79 |
64.44 - 71.69 |
0.8249 times |
Fri 29 August 2025 |
66.03 (-0.56%) |
65.33 |
64.00 - 67.33 |
0.8838 times |
Thu 31 July 2025 |
66.40 (1.92%) |
65.00 |
63.52 - 67.60 |
0.6903 times |
Mon 30 June 2025 |
65.15 (9%) |
59.38 |
59.38 - 65.34 |
0.7428 times |
Fri 30 May 2025 |
59.77 (12.2%) |
55.00 |
54.30 - 61.02 |
1.6689 times |
Wed 30 April 2025 |
53.27 (6.92%) |
49.56 |
42.50 - 53.85 |
0.9763 times |
Mon 31 March 2025 |
49.82 (-10.28%) |
56.14 |
48.27 - 56.21 |
1.107 times |
Fri 28 February 2025 |
55.53 (-5.56%) |
57.66 |
53.97 - 61.34 |
1.3868 times |
Fri 31 January 2025 |
58.80 (2.51%) |
57.80 |
55.60 - 60.85 |
1.1006 times |
Tue 31 December 2024 |
57.36 (6.16%) |
54.17 |
54.17 - 60.60 |
0.7949 times |

DMA SMA EMA moving averages of Microsectors Fang FNGS
DMA (daily moving average) of Microsectors Fang FNGS
| DMA period | DMA value | | 5 day DMA | 70.22 | | 12 day DMA | 69.94 | | 20 day DMA | 69.87 | | 35 day DMA | 69.85 | | 50 day DMA | 68.71 | | 100 day DMA | 66.41 | | 150 day DMA | 62 | | 200 day DMA | 60.7 | EMA (exponential moving average) of Microsectors Fang FNGS
| EMA period | EMA current | EMA prev | EMA prev2 | | 5 day EMA | 70.15 | 70.06 | 70.2 | | 12 day EMA | 69.98 | 69.91 | 69.94 | | 20 day EMA | 69.82 | 69.76 | 69.76 | | 35 day EMA | 69.22 | 69.15 | 69.11 | | 50 day EMA | 68.69 | 68.62 | 68.57 |
SMA (simple moving average) of Microsectors Fang FNGS
| SMA period | SMA current | SMA prev | SMA prev2 | | 5 day SMA | 70.22 | 69.96 | 69.88 | | 12 day SMA | 69.94 | 69.88 | 69.87 | | 20 day SMA | 69.87 | 69.84 | 69.84 | | 35 day SMA | 69.85 | 69.76 | 69.67 | | 50 day SMA | 68.71 | 68.65 | 68.58 | | 100 day SMA | 66.41 | 66.3 | 66.2 | | 150 day SMA | 62 | 61.88 | 61.76 | | 200 day SMA | 60.7 | 60.64 | 60.58 |
|
|
