AmericanCentury FLV full analysis,charts,indicators,moving averages,SMA,DMA,EMA,ADX,MACD,RSIAmerican Century FLV WideScreen charts, DMA,SMA,EMA technical analysis, forecast prediction, by indicators ADX,MACD,RSI,CCI AMEX stock exchange
Daily price and charts and targets AmericanCentury Strong Daily Stock price targets for AmericanCentury FLV are 73.74 and 74.09 | Daily Target 1 | 73.47 | | Daily Target 2 | 73.66 | | Daily Target 3 | 73.82 | | Daily Target 4 | 74.01 | | Daily Target 5 | 74.17 |
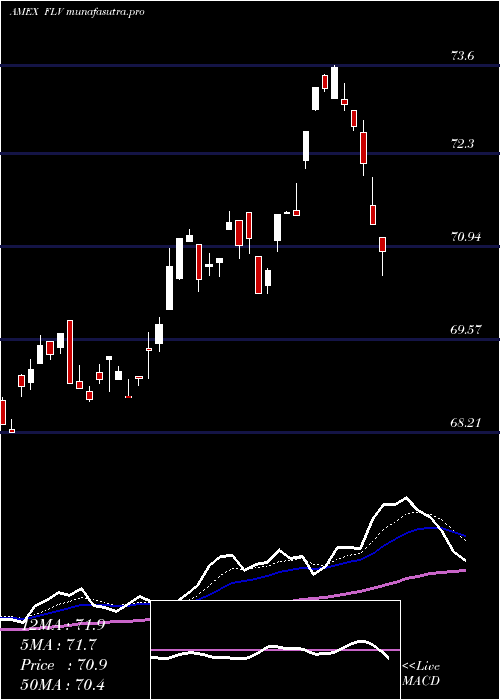
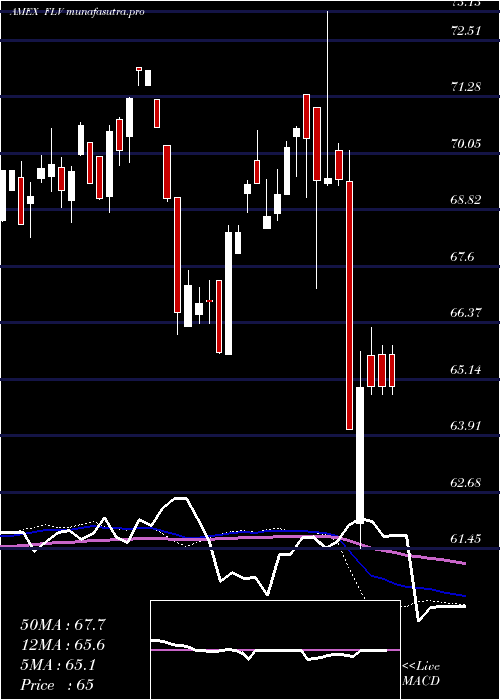
Daily price and volume American Century
| Date |
Closing |
Open |
Range |
Volume |
Thu 23 October 2025 |
73.85 (-0.07%) |
73.63 |
73.63 - 73.98 |
2.3914 times |
Wed 22 October 2025 |
73.90 (-0.19%) |
74.20 |
73.77 - 74.30 |
0.3225 times |
Tue 21 October 2025 |
74.04 (-0.03%) |
74.51 |
74.04 - 74.51 |
0.2879 times |
Mon 20 October 2025 |
74.06 (0.94%) |
73.80 |
73.80 - 74.13 |
0.4008 times |
Fri 17 October 2025 |
73.37 (0.59%) |
73.01 |
73.01 - 73.37 |
0.2081 times |
Thu 16 October 2025 |
72.94 (-0.94%) |
73.64 |
72.94 - 73.81 |
1.226 times |
Wed 15 October 2025 |
73.63 (-0.12%) |
74.15 |
73.25 - 74.15 |
0.1291 times |
Tue 14 October 2025 |
73.72 (0.99%) |
73.13 |
73.13 - 73.91 |
4.21 times |
Mon 13 October 2025 |
73.00 (0.83%) |
72.85 |
72.81 - 73.30 |
0.4567 times |
Fri 10 October 2025 |
72.40 (-1.43%) |
73.61 |
72.40 - 73.69 |
0.3674 times |
Thu 09 October 2025 |
73.45 (-0.42%) |
73.76 |
73.30 - 73.76 |
0.1986 times |
Weekly price and charts AmericanCentury Strong weekly Stock price targets for AmericanCentury FLV are 73.74 and 74.62 | Weekly Target 1 | 73.12 | | Weekly Target 2 | 73.48 | | Weekly Target 3 | 73.996666666667 | | Weekly Target 4 | 74.36 | | Weekly Target 5 | 74.88 |
Weekly price and volumes for American Century
| Date |
Closing |
Open |
Range |
Volume |
Thu 23 October 2025 |
73.85 (0.65%) |
73.80 |
73.63 - 74.51 |
1.2522 times |
Fri 17 October 2025 |
73.37 (1.34%) |
72.85 |
72.81 - 74.15 |
2.2927 times |
Fri 10 October 2025 |
72.40 (-2.2%) |
73.97 |
72.40 - 74.07 |
0.8084 times |
Fri 03 October 2025 |
74.03 (0.89%) |
73.31 |
73.19 - 74.29 |
1.0206 times |
Fri 26 September 2025 |
73.38 (-0.45%) |
73.54 |
72.83 - 73.76 |
1.0158 times |
Fri 19 September 2025 |
73.71 (-0.32%) |
73.80 |
73.22 - 74.01 |
0.6431 times |
Fri 12 September 2025 |
73.95 (-0.04%) |
73.50 |
73.07 - 74.18 |
1.7065 times |
Fri 05 September 2025 |
73.98 (-0.74%) |
74.02 |
73.62 - 74.35 |
0.5043 times |
Fri 29 August 2025 |
74.53 (0%) |
74.29 |
74.29 - 74.53 |
0.0219 times |
Fri 29 August 2025 |
74.53 (-0.41%) |
74.40 |
74.14 - 74.64 |
0.7345 times |
Fri 22 August 2025 |
74.84 (2.11%) |
73.32 |
73.19 - 74.96 |
5.9452 times |
Monthly price and charts AmericanCentury Strong monthly Stock price targets for AmericanCentury FLV are 73.13 and 75.24 | Monthly Target 1 | 71.48 | | Monthly Target 2 | 72.66 | | Monthly Target 3 | 73.586666666667 | | Monthly Target 4 | 74.77 | | Monthly Target 5 | 75.7 |
Monthly price and volumes American Century
| Date |
Closing |
Open |
Range |
Volume |
Thu 23 October 2025 |
73.85 (0.14%) |
73.61 |
72.40 - 74.51 |
0.617 times |
Tue 30 September 2025 |
73.75 (-1.05%) |
74.02 |
72.83 - 74.35 |
0.573 times |
Fri 29 August 2025 |
74.53 (4.59%) |
71.07 |
70.52 - 74.96 |
1.1431 times |
Thu 31 July 2025 |
71.26 (2.11%) |
70.02 |
70.02 - 73.60 |
0.7595 times |
Mon 30 June 2025 |
69.79 (1.47%) |
68.01 |
68.01 - 69.90 |
1.0773 times |
Fri 30 May 2025 |
68.78 (2.43%) |
66.70 |
66.45 - 69.97 |
1.0773 times |
Wed 30 April 2025 |
67.15 (-3.92%) |
69.10 |
61.45 - 69.66 |
1.8509 times |
Mon 31 March 2025 |
69.89 (-0.99%) |
71.32 |
67.10 - 73.13 |
1.9263 times |
Fri 28 February 2025 |
70.59 (1.71%) |
68.41 |
68.41 - 70.63 |
0.4615 times |
Fri 31 January 2025 |
69.40 (3.97%) |
67.13 |
65.67 - 70.54 |
0.5141 times |
Tue 31 December 2024 |
66.75 (-7.09%) |
71.21 |
66.11 - 71.21 |
0.8438 times |

DMA SMA EMA moving averages of American Century FLV
DMA (daily moving average) of American Century FLV
| DMA period | DMA value | | 5 day DMA | 73.84 | | 12 day DMA | 73.51 | | 20 day DMA | 73.59 | | 35 day DMA | 73.58 | | 50 day DMA | 73.73 | | 100 day DMA | 72.23 | | 150 day DMA | 70.59 | | 200 day DMA | 70.2 | EMA (exponential moving average) of American Century FLV
| EMA period | EMA current | EMA prev | EMA prev2 | | 5 day EMA | 73.8 | 73.77 | 73.71 | | 12 day EMA | 73.66 | 73.63 | 73.58 | | 20 day EMA | 73.61 | 73.59 | 73.56 | | 35 day EMA | 73.64 | 73.63 | 73.61 | | 50 day EMA | 73.69 | 73.68 | 73.67 |
SMA (simple moving average) of American Century FLV
| SMA period | SMA current | SMA prev | SMA prev2 | | 5 day SMA | 73.84 | 73.66 | 73.61 | | 12 day SMA | 73.51 | 73.51 | 73.51 | | 20 day SMA | 73.59 | 73.54 | 73.51 | | 35 day SMA | 73.58 | 73.59 | 73.59 | | 50 day SMA | 73.73 | 73.73 | 73.72 | | 100 day SMA | 72.23 | 72.18 | 72.12 | | 150 day SMA | 70.59 | 70.56 | 70.54 | | 200 day SMA | 70.2 | 70.17 | 70.13 |
|
|
