FranklinLibertyq FLQL full analysis,charts,indicators,moving averages,SMA,DMA,EMA,ADX,MACD,RSIFranklin Libertyq FLQL WideScreen charts, DMA,SMA,EMA technical analysis, forecast prediction, by indicators ADX,MACD,RSI,CCI AMEX stock exchange
Daily price and charts and targets FranklinLibertyq Strong Daily Stock price targets for FranklinLibertyq FLQL are 68.09 and 68.54 | Daily Target 1 | 67.75 | | Daily Target 2 | 67.98 | | Daily Target 3 | 68.196666666667 | | Daily Target 4 | 68.43 | | Daily Target 5 | 68.65 |
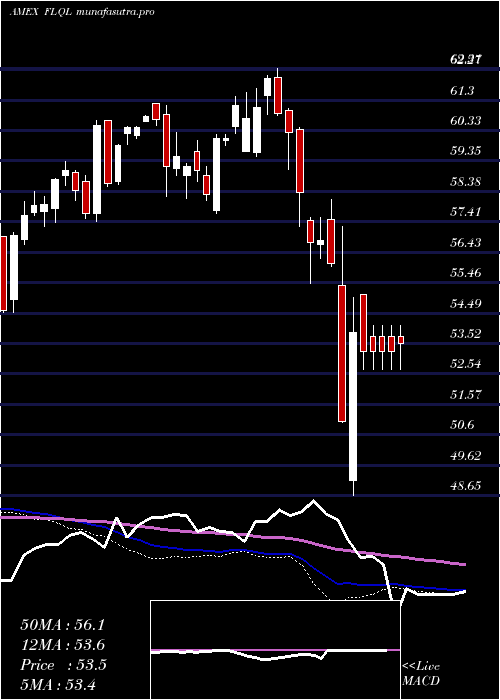
Daily price and volume Franklin Libertyq
| Date |
Closing |
Open |
Range |
Volume |
Thu 23 October 2025 |
68.22 (0.46%) |
68.01 |
67.96 - 68.41 |
0.635 times |
Wed 22 October 2025 |
67.91 (-0.76%) |
68.36 |
67.51 - 68.39 |
1.4387 times |
Tue 21 October 2025 |
68.43 (-0.2%) |
68.56 |
68.23 - 68.56 |
0.8307 times |
Mon 20 October 2025 |
68.57 (1.09%) |
68.12 |
68.12 - 68.65 |
0.8321 times |
Fri 17 October 2025 |
67.83 (0.38%) |
67.45 |
67.27 - 67.93 |
0.772 times |
Thu 16 October 2025 |
67.57 (-0.59%) |
68.11 |
67.16 - 68.22 |
1.0622 times |
Wed 15 October 2025 |
67.97 (0.64%) |
68.18 |
67.39 - 68.45 |
1.6329 times |
Tue 14 October 2025 |
67.54 (0.01%) |
66.85 |
66.69 - 67.91 |
0.9445 times |
Mon 13 October 2025 |
67.53 (1.49%) |
67.49 |
67.27 - 67.70 |
0.6486 times |
Fri 10 October 2025 |
66.54 (-2.52%) |
68.45 |
66.54 - 68.52 |
1.2033 times |
Thu 09 October 2025 |
68.26 (-0.5%) |
68.61 |
68.13 - 68.61 |
0.953 times |

Weekly price and charts FranklinLibertyq Strong weekly Stock price targets for FranklinLibertyq FLQL are 67.87 and 69.01 | Weekly Target 1 | 66.99 | | Weekly Target 2 | 67.6 | | Weekly Target 3 | 68.126666666667 | | Weekly Target 4 | 68.74 | | Weekly Target 5 | 69.27 |
Weekly price and volumes for Franklin Libertyq
| Date |
Closing |
Open |
Range |
Volume |
Thu 23 October 2025 |
68.22 (0.57%) |
68.12 |
67.51 - 68.65 |
0.36 times |
Fri 17 October 2025 |
67.83 (1.94%) |
67.49 |
66.69 - 68.45 |
0.4875 times |
Fri 10 October 2025 |
66.54 (-2.61%) |
68.52 |
66.54 - 68.65 |
0.4696 times |
Fri 03 October 2025 |
68.32 (0.46%) |
68.35 |
67.98 - 68.74 |
1.1806 times |
Fri 26 September 2025 |
68.01 (-0.23%) |
68.01 |
67.24 - 68.50 |
0.5496 times |
Fri 19 September 2025 |
68.17 (0.96%) |
67.66 |
67.28 - 68.23 |
0.5348 times |
Fri 12 September 2025 |
67.52 (1.4%) |
66.62 |
66.62 - 67.70 |
0.6924 times |
Fri 05 September 2025 |
66.59 (0.82%) |
65.24 |
65.15 - 67.05 |
3.8242 times |
Fri 29 August 2025 |
66.05 (0%) |
66.26 |
65.88 - 66.26 |
0.6899 times |
Fri 29 August 2025 |
66.05 (0%) |
65.91 |
65.78 - 66.51 |
1.2115 times |
Fri 22 August 2025 |
66.05 (0.11%) |
65.93 |
64.96 - 66.23 |
0.5348 times |
Monthly price and charts FranklinLibertyq Strong monthly Stock price targets for FranklinLibertyq FLQL are 67.38 and 69.58 | Monthly Target 1 | 65.63 | | Monthly Target 2 | 66.93 | | Monthly Target 3 | 67.833333333333 | | Monthly Target 4 | 69.13 | | Monthly Target 5 | 70.03 |
Monthly price and volumes Franklin Libertyq
| Date |
Closing |
Open |
Range |
Volume |
Thu 23 October 2025 |
68.22 (-0.31%) |
68.08 |
66.54 - 68.74 |
0.4189 times |
Tue 30 September 2025 |
68.43 (3.6%) |
65.24 |
65.15 - 68.50 |
1.4152 times |
Fri 29 August 2025 |
66.05 (2.51%) |
63.74 |
63.30 - 66.51 |
1.0124 times |
Thu 31 July 2025 |
64.43 (2.01%) |
63.06 |
62.68 - 65.18 |
0.7804 times |
Mon 30 June 2025 |
63.16 (5.21%) |
59.92 |
59.89 - 63.25 |
1.1704 times |
Fri 30 May 2025 |
60.03 (6.32%) |
57.00 |
56.70 - 60.68 |
0.6443 times |
Wed 30 April 2025 |
56.46 (0.04%) |
56.27 |
48.65 - 57.25 |
2.0725 times |
Mon 31 March 2025 |
56.44 (-6.35%) |
60.36 |
55.14 - 60.43 |
0.8974 times |
Fri 28 February 2025 |
60.27 (-0.71%) |
59.63 |
59.07 - 62.31 |
0.917 times |
Fri 31 January 2025 |
60.70 (3.51%) |
58.84 |
57.68 - 61.55 |
0.6716 times |
Tue 31 December 2024 |
58.64 (-2.96%) |
60.62 |
58.23 - 61.19 |
0.5008 times |

DMA SMA EMA moving averages of Franklin Libertyq FLQL
DMA (daily moving average) of Franklin Libertyq FLQL
| DMA period | DMA value | | 5 day DMA | 68.19 | | 12 day DMA | 67.91 | | 20 day DMA | 68.08 | | 35 day DMA | 67.86 | | 50 day DMA | 67.3 | | 100 day DMA | 65.24 | | 150 day DMA | 62.29 | | 200 day DMA | 61.64 | EMA (exponential moving average) of Franklin Libertyq FLQL
| EMA period | EMA current | EMA prev | EMA prev2 | | 5 day EMA | 68.12 | 68.07 | 68.15 | | 12 day EMA | 68.03 | 68 | 68.02 | | 20 day EMA | 67.94 | 67.91 | 67.91 | | 35 day EMA | 67.6 | 67.56 | 67.54 | | 50 day EMA | 67.29 | 67.25 | 67.22 |
SMA (simple moving average) of Franklin Libertyq FLQL
| SMA period | SMA current | SMA prev | SMA prev2 | | 5 day SMA | 68.19 | 68.06 | 68.07 | | 12 day SMA | 67.91 | 67.91 | 67.96 | | 20 day SMA | 68.08 | 68.05 | 68.05 | | 35 day SMA | 67.86 | 67.82 | 67.77 | | 50 day SMA | 67.3 | 67.26 | 67.23 | | 100 day SMA | 65.24 | 65.15 | 65.08 | | 150 day SMA | 62.29 | 62.22 | 62.15 | | 200 day SMA | 61.64 | 61.59 | 61.55 |
|
|
