CanadaFranklin FLCA full analysis,charts,indicators,moving averages,SMA,DMA,EMA,ADX,MACD,RSICanada Franklin FLCA WideScreen charts, DMA,SMA,EMA technical analysis, forecast prediction, by indicators ADX,MACD,RSI,CCI AMEX stock exchange
Daily price and charts and targets CanadaFranklin Strong Daily Stock price targets for CanadaFranklin FLCA are 45.25 and 45.43 | Daily Target 1 | 45.21 | | Daily Target 2 | 45.29 | | Daily Target 3 | 45.39 | | Daily Target 4 | 45.47 | | Daily Target 5 | 45.57 |
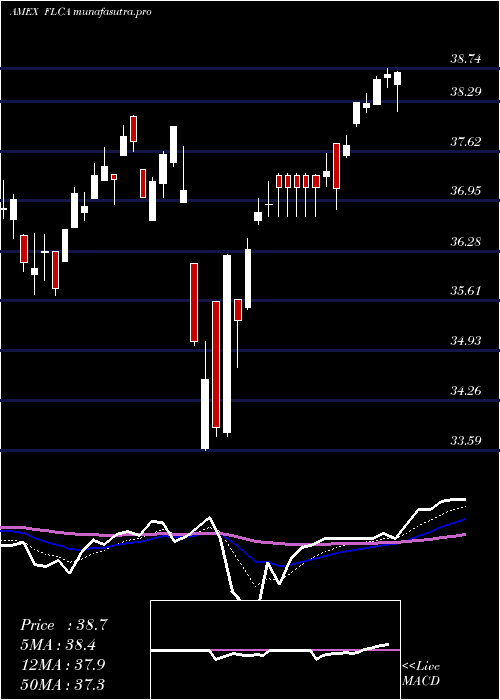
Daily price and volume Canada Franklin
| Date |
Closing |
Open |
Range |
Volume |
Thu 23 October 2025 |
45.37 (0.6%) |
45.47 |
45.31 - 45.49 |
6.4768 times |
Wed 22 October 2025 |
45.10 (0.74%) |
44.58 |
44.58 - 45.13 |
0.354 times |
Tue 21 October 2025 |
44.77 (-1.67%) |
45.15 |
44.77 - 45.15 |
0.3083 times |
Mon 20 October 2025 |
45.53 (0.84%) |
45.29 |
45.29 - 45.57 |
0.1689 times |
Fri 17 October 2025 |
45.15 (-0.55%) |
45.14 |
44.87 - 45.23 |
0.4485 times |
Thu 16 October 2025 |
45.40 (-0.72%) |
46.04 |
45.30 - 46.04 |
0.1529 times |
Wed 15 October 2025 |
45.73 (0.86%) |
45.71 |
45.44 - 45.98 |
0.8471 times |
Tue 14 October 2025 |
45.34 (-0.11%) |
45.01 |
44.66 - 45.56 |
0.5574 times |
Mon 13 October 2025 |
45.39 (1.52%) |
45.14 |
45.14 - 45.57 |
0.2321 times |
Fri 10 October 2025 |
44.71 (-1.39%) |
45.38 |
44.69 - 45.54 |
0.454 times |
Thu 09 October 2025 |
45.34 (-1.31%) |
46.08 |
45.27 - 46.08 |
0.166 times |
Weekly price and charts CanadaFranklin Strong weekly Stock price targets for CanadaFranklin FLCA are 44.98 and 45.97 | Weekly Target 1 | 44.18 | | Weekly Target 2 | 44.78 | | Weekly Target 3 | 45.173333333333 | | Weekly Target 4 | 45.77 | | Weekly Target 5 | 46.16 |
Weekly price and volumes for Canada Franklin
| Date |
Closing |
Open |
Range |
Volume |
Thu 23 October 2025 |
45.37 (0.49%) |
45.29 |
44.58 - 45.57 |
2.6644 times |
Fri 17 October 2025 |
45.15 (0.98%) |
45.14 |
44.66 - 46.04 |
0.8159 times |
Fri 10 October 2025 |
44.71 (-2.83%) |
46.18 |
44.69 - 46.35 |
0.8337 times |
Fri 03 October 2025 |
46.01 (2.56%) |
45.27 |
44.99 - 46.01 |
0.5825 times |
Fri 26 September 2025 |
44.86 (-1.32%) |
45.68 |
44.68 - 45.88 |
0.5225 times |
Fri 19 September 2025 |
45.46 (2.13%) |
44.48 |
44.48 - 45.62 |
3.4606 times |
Fri 12 September 2025 |
44.51 (0.95%) |
44.33 |
44.02 - 44.76 |
0.4027 times |
Fri 05 September 2025 |
44.09 (0.41%) |
43.82 |
43.50 - 44.41 |
0.3626 times |
Fri 29 August 2025 |
43.91 (0%) |
43.47 |
43.47 - 43.98 |
0.0649 times |
Fri 29 August 2025 |
43.91 (1.95%) |
43.01 |
42.71 - 43.98 |
0.2903 times |
Fri 22 August 2025 |
43.07 (1.25%) |
42.65 |
42.26 - 43.25 |
0.42 times |

Monthly price and charts CanadaFranklin Strong monthly Stock price targets for CanadaFranklin FLCA are 44.09 and 45.86 | Monthly Target 1 | 43.66 | | Monthly Target 2 | 44.52 | | Monthly Target 3 | 45.433333333333 | | Monthly Target 4 | 46.29 | | Monthly Target 5 | 47.2 |
Monthly price and volumes Canada Franklin
| Date |
Closing |
Open |
Range |
Volume |
Thu 23 October 2025 |
45.37 (-0.07%) |
45.50 |
44.58 - 46.35 |
1.3416 times |
Tue 30 September 2025 |
45.40 (3.39%) |
43.82 |
43.50 - 45.88 |
1.4594 times |
Fri 29 August 2025 |
43.91 (5.6%) |
41.50 |
41.15 - 43.98 |
0.5243 times |
Thu 31 July 2025 |
41.58 (-0.41%) |
41.80 |
41.49 - 42.60 |
0.578 times |
Mon 30 June 2025 |
41.75 (2.08%) |
41.14 |
40.64 - 41.86 |
0.4891 times |
Fri 30 May 2025 |
40.90 (5.74%) |
38.68 |
38.51 - 40.91 |
0.796 times |
Wed 30 April 2025 |
38.68 (3.95%) |
37.19 |
33.59 - 38.74 |
1.0251 times |
Mon 31 March 2025 |
37.21 (-1.35%) |
38.01 |
35.68 - 38.17 |
0.7506 times |
Fri 28 February 2025 |
37.72 (0.16%) |
36.69 |
36.37 - 38.88 |
0.9238 times |
Fri 31 January 2025 |
37.66 (2.9%) |
36.72 |
36.22 - 38.42 |
2.112 times |
Tue 31 December 2024 |
36.60 (-5.79%) |
39.33 |
35.69 - 39.37 |
0.4498 times |

DMA SMA EMA moving averages of Canada Franklin FLCA
DMA (daily moving average) of Canada Franklin FLCA
| DMA period | DMA value | | 5 day DMA | 45.18 | | 12 day DMA | 45.31 | | 20 day DMA | 45.4 | | 35 day DMA | 45.15 | | 50 day DMA | 44.57 | | 100 day DMA | 43.19 | | 150 day DMA | 41.52 | | 200 day DMA | 40.49 | EMA (exponential moving average) of Canada Franklin FLCA
| EMA period | EMA current | EMA prev | EMA prev2 | | 5 day EMA | 45.24 | 45.17 | 45.2 | | 12 day EMA | 45.29 | 45.28 | 45.31 | | 20 day EMA | 45.23 | 45.22 | 45.23 | | 35 day EMA | 44.88 | 44.85 | 44.84 | | 50 day EMA | 44.47 | 44.43 | 44.4 |
SMA (simple moving average) of Canada Franklin FLCA
| SMA period | SMA current | SMA prev | SMA prev2 | | 5 day SMA | 45.18 | 45.19 | 45.32 | | 12 day SMA | 45.31 | 45.35 | 45.43 | | 20 day SMA | 45.4 | 45.37 | 45.38 | | 35 day SMA | 45.15 | 45.12 | 45.08 | | 50 day SMA | 44.57 | 44.51 | 44.46 | | 100 day SMA | 43.19 | 43.14 | 43.1 | | 150 day SMA | 41.52 | 41.46 | 41.41 | | 200 day SMA | 40.49 | 40.45 | 40.41 |
|
|
