IseWater FIW full analysis,charts,indicators,moving averages,SMA,DMA,EMA,ADX,MACD,RSIIse Water FIW WideScreen charts, DMA,SMA,EMA technical analysis, forecast prediction, by indicators ADX,MACD,RSI,CCI AMEX stock exchange
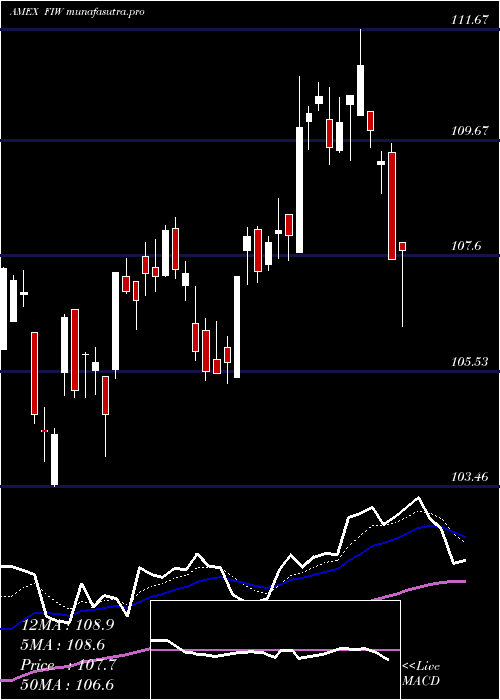
Daily price and charts and targets IseWater Strong Daily Stock price targets for IseWater FIW are 114.66 and 115.68 | Daily Target 1 | 113.82 | | Daily Target 2 | 114.48 | | Daily Target 3 | 114.84 | | Daily Target 4 | 115.5 | | Daily Target 5 | 115.86 |
Daily price and volume Ise Water
| Date |
Closing |
Open |
Range |
Volume |
Thu 23 October 2025 |
115.14 (0.52%) |
114.44 |
114.18 - 115.20 |
0.535 times |
Wed 22 October 2025 |
114.55 (-0.99%) |
115.90 |
114.51 - 115.90 |
1.1566 times |
Tue 21 October 2025 |
115.70 (0.61%) |
114.82 |
114.75 - 115.93 |
1.1724 times |
Mon 20 October 2025 |
115.00 (1.37%) |
113.24 |
113.24 - 115.05 |
0.6596 times |
Fri 17 October 2025 |
113.45 (0.27%) |
112.91 |
112.86 - 113.57 |
0.7015 times |
Thu 16 October 2025 |
113.15 (-0.3%) |
113.83 |
112.75 - 113.96 |
1.4314 times |
Wed 15 October 2025 |
113.49 (0.22%) |
113.77 |
112.92 - 114.22 |
1.0384 times |
Tue 14 October 2025 |
113.24 (1.07%) |
111.01 |
111.01 - 113.77 |
0.9305 times |
Mon 13 October 2025 |
112.04 (0.86%) |
111.96 |
111.73 - 112.55 |
1.1464 times |
Fri 10 October 2025 |
111.09 (-1.57%) |
112.94 |
111.00 - 113.22 |
1.2282 times |
Thu 09 October 2025 |
112.86 (-1.18%) |
114.08 |
112.49 - 114.09 |
1.0794 times |
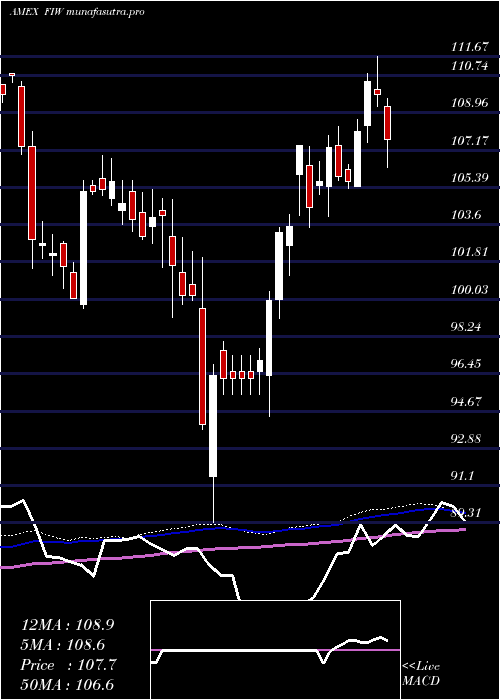
Weekly price and charts IseWater Strong weekly Stock price targets for IseWater FIW are 114.19 and 116.88 | Weekly Target 1 | 112.08 | | Weekly Target 2 | 113.61 | | Weekly Target 3 | 114.77 | | Weekly Target 4 | 116.3 | | Weekly Target 5 | 117.46 |
Weekly price and volumes for Ise Water
| Date |
Closing |
Open |
Range |
Volume |
Thu 23 October 2025 |
115.14 (1.49%) |
113.24 |
113.24 - 115.93 |
0.5826 times |
Fri 17 October 2025 |
113.45 (2.12%) |
111.96 |
111.01 - 114.22 |
0.8678 times |
Fri 10 October 2025 |
111.09 (-2.39%) |
114.07 |
111.00 - 114.27 |
0.9406 times |
Fri 03 October 2025 |
113.81 (2.53%) |
111.54 |
110.79 - 114.44 |
2.4249 times |
Fri 26 September 2025 |
111.00 (-1.02%) |
111.96 |
109.50 - 112.75 |
0.8222 times |
Fri 19 September 2025 |
112.14 (0.22%) |
112.26 |
111.23 - 113.43 |
1.12 times |
Fri 12 September 2025 |
111.89 (-2.53%) |
114.86 |
111.00 - 114.97 |
1.6511 times |
Fri 05 September 2025 |
114.79 (0.92%) |
112.81 |
111.91 - 115.57 |
0.6849 times |
Fri 29 August 2025 |
113.74 (0%) |
114.58 |
113.49 - 114.60 |
0.1206 times |
Fri 29 August 2025 |
113.74 (-1.16%) |
114.85 |
113.49 - 114.95 |
0.7853 times |
Fri 22 August 2025 |
115.08 (2.11%) |
112.82 |
112.18 - 115.58 |
1.1957 times |
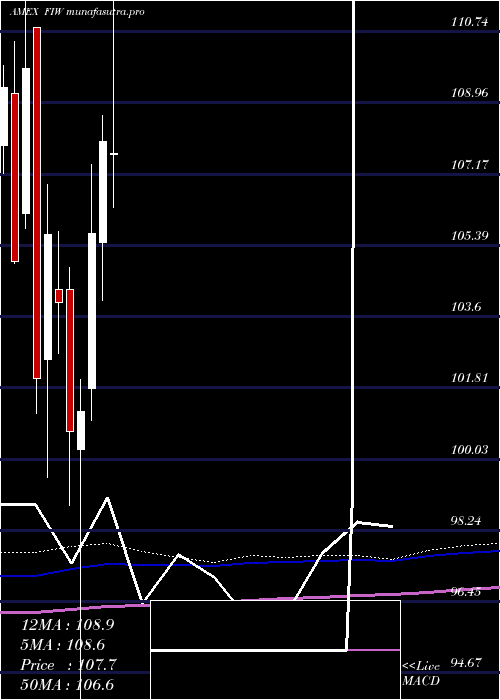
Monthly price and charts IseWater Strong monthly Stock price targets for IseWater FIW are 113.07 and 118 | Monthly Target 1 | 109.09 | | Monthly Target 2 | 112.12 | | Monthly Target 3 | 114.02333333333 | | Monthly Target 4 | 117.05 | | Monthly Target 5 | 118.95 |
Monthly price and volumes Ise Water
| Date |
Closing |
Open |
Range |
Volume |
Thu 23 October 2025 |
115.14 (2.48%) |
112.11 |
111.00 - 115.93 |
0.8603 times |
Tue 30 September 2025 |
112.35 (-1.22%) |
112.81 |
109.50 - 115.57 |
0.8693 times |
Fri 29 August 2025 |
113.74 (4.8%) |
108.02 |
107.07 - 115.58 |
0.8117 times |
Thu 31 July 2025 |
108.53 (0.51%) |
107.67 |
106.33 - 111.67 |
0.8788 times |
Mon 30 June 2025 |
107.98 (2.18%) |
105.44 |
104.00 - 108.64 |
0.7016 times |
Fri 30 May 2025 |
105.68 (4.42%) |
101.80 |
100.98 - 107.40 |
1.1242 times |
Wed 30 April 2025 |
101.21 (0.5%) |
100.26 |
89.31 - 102.02 |
1.2875 times |
Mon 31 March 2025 |
100.71 (-3.12%) |
104.27 |
98.87 - 104.83 |
0.9438 times |
Fri 28 February 2025 |
103.95 (-1.63%) |
104.26 |
102.68 - 105.72 |
1.1327 times |
Fri 31 January 2025 |
105.67 (3.55%) |
102.53 |
99.56 - 106.90 |
1.3901 times |
Tue 31 December 2024 |
102.05 (-7.08%) |
110.83 |
101.17 - 110.85 |
1.1991 times |
DMA SMA EMA moving averages of Ise Water FIW
DMA (daily moving average) of Ise Water FIW
| DMA period | DMA value | | 5 day DMA | 114.77 | | 12 day DMA | 113.66 | | 20 day DMA | 113.23 | | 35 day DMA | 112.78 | | 50 day DMA | 113 | | 100 day DMA | 110.92 | | 150 day DMA | 107.53 | | 200 day DMA | 106.6 | EMA (exponential moving average) of Ise Water FIW
| EMA period | EMA current | EMA prev | EMA prev2 | | 5 day EMA | 114.69 | 114.46 | 114.41 | | 12 day EMA | 113.96 | 113.75 | 113.6 | | 20 day EMA | 113.52 | 113.35 | 113.22 | | 35 day EMA | 113.29 | 113.18 | 113.1 | | 50 day EMA | 113.15 | 113.07 | 113.01 |
SMA (simple moving average) of Ise Water FIW
| SMA period | SMA current | SMA prev | SMA prev2 | | 5 day SMA | 114.77 | 114.37 | 114.16 | | 12 day SMA | 113.66 | 113.48 | 113.41 | | 20 day SMA | 113.23 | 112.96 | 112.76 | | 35 day SMA | 112.78 | 112.75 | 112.68 | | 50 day SMA | 113 | 112.96 | 112.97 | | 100 day SMA | 110.92 | 110.83 | 110.74 | | 150 day SMA | 107.53 | 107.43 | 107.35 | | 200 day SMA | 106.6 | 106.54 | 106.47 |
|
|
