SpdrSsga FISR full analysis,charts,indicators,moving averages,SMA,DMA,EMA,ADX,MACD,RSISpdr Ssga FISR WideScreen charts, DMA,SMA,EMA technical analysis, forecast prediction, by indicators ADX,MACD,RSI,CCI AMEX stock exchange
Daily price and charts and targets SpdrSsga Strong Daily Stock price targets for SpdrSsga FISR are 26.29 and 26.33 | Daily Target 1 | 26.26 | | Daily Target 2 | 26.28 | | Daily Target 3 | 26.296666666667 | | Daily Target 4 | 26.32 | | Daily Target 5 | 26.34 |
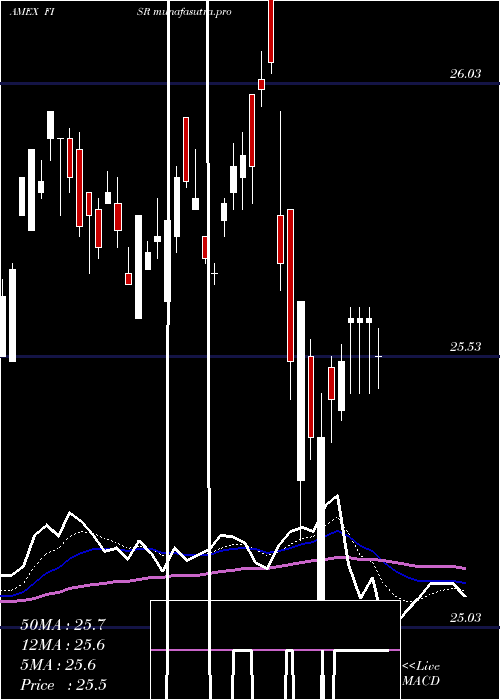
Daily price and volume Spdr Ssga
| Date |
Closing |
Open |
Range |
Volume |
Fri 24 October 2025 |
26.31 (0.11%) |
26.27 |
26.27 - 26.31 |
0.541 times |
Thu 23 October 2025 |
26.28 (-0.27%) |
26.25 |
26.25 - 26.32 |
0.4532 times |
Wed 22 October 2025 |
26.35 (0%) |
26.32 |
26.31 - 26.35 |
0.6559 times |
Tue 21 October 2025 |
26.35 (0.15%) |
26.38 |
26.34 - 26.38 |
0.6273 times |
Mon 20 October 2025 |
26.31 (0.23%) |
26.28 |
26.27 - 26.31 |
1.4026 times |
Fri 17 October 2025 |
26.25 (-0.19%) |
26.27 |
26.23 - 26.27 |
0.6977 times |
Thu 16 October 2025 |
26.30 (0.42%) |
26.24 |
26.19 - 26.30 |
0.8872 times |
Wed 15 October 2025 |
26.19 (-0.08%) |
26.17 |
26.12 - 26.25 |
0.6723 times |
Tue 14 October 2025 |
26.21 (0.04%) |
26.12 |
26.12 - 26.22 |
1.0963 times |
Mon 13 October 2025 |
26.20 (0.65%) |
26.16 |
26.09 - 26.20 |
2.9665 times |
Tue 07 October 2025 |
26.03 (0.15%) |
26.00 |
26.00 - 26.05 |
0.5785 times |
Weekly price and charts SpdrSsga Strong weekly Stock price targets for SpdrSsga FISR are 26.28 and 26.41 | Weekly Target 1 | 26.18 | | Weekly Target 2 | 26.25 | | Weekly Target 3 | 26.313333333333 | | Weekly Target 4 | 26.38 | | Weekly Target 5 | 26.44 |
Weekly price and volumes for Spdr Ssga
| Date |
Closing |
Open |
Range |
Volume |
Fri 24 October 2025 |
26.31 (0.23%) |
26.28 |
26.25 - 26.38 |
0.6517 times |
Fri 17 October 2025 |
26.25 (0.85%) |
26.16 |
26.09 - 26.30 |
1.1192 times |
Tue 07 October 2025 |
26.03 (-0.08%) |
26.04 |
25.98 - 26.05 |
0.2667 times |
Fri 03 October 2025 |
26.05 (0.19%) |
26.05 |
26.01 - 26.11 |
0.5721 times |
Fri 26 September 2025 |
26.00 (-0.23%) |
26.07 |
25.96 - 26.12 |
0.4191 times |
Fri 19 September 2025 |
26.06 (-0.34%) |
26.17 |
26.05 - 26.25 |
0.7752 times |
Fri 12 September 2025 |
26.15 (0.42%) |
26.10 |
26.05 - 26.20 |
5.1819 times |
Fri 05 September 2025 |
26.04 (0.58%) |
25.71 |
25.70 - 26.12 |
0.4011 times |
Fri 29 August 2025 |
25.89 (0%) |
25.90 |
25.88 - 25.92 |
0.0806 times |
Fri 29 August 2025 |
25.89 (0%) |
25.82 |
25.81 - 25.93 |
0.5323 times |
Fri 22 August 2025 |
25.89 (0.54%) |
25.69 |
25.65 - 25.89 |
0.5866 times |

Monthly price and charts SpdrSsga Strong monthly Stock price targets for SpdrSsga FISR are 26.15 and 26.55 | Monthly Target 1 | 25.82 | | Monthly Target 2 | 26.07 | | Monthly Target 3 | 26.223333333333 | | Monthly Target 4 | 26.47 | | Monthly Target 5 | 26.62 |
Monthly price and volumes Spdr Ssga
| Date |
Closing |
Open |
Range |
Volume |
Fri 24 October 2025 |
26.31 (0.96%) |
26.10 |
25.98 - 26.38 |
0.3108 times |
Tue 30 September 2025 |
26.06 (0.66%) |
25.71 |
25.70 - 26.25 |
0.8956 times |
Fri 29 August 2025 |
25.89 (0.98%) |
25.66 |
25.65 - 25.93 |
2.6894 times |
Thu 31 July 2025 |
25.64 (-0.77%) |
25.75 |
25.38 - 25.76 |
1.1761 times |
Mon 30 June 2025 |
25.84 (1.37%) |
25.32 |
25.22 - 25.84 |
0.5225 times |
Fri 30 May 2025 |
25.49 (-1.39%) |
25.68 |
25.04 - 25.78 |
1.1994 times |
Wed 30 April 2025 |
25.85 (-0.12%) |
25.86 |
25.03 - 26.26 |
1.2134 times |
Mon 31 March 2025 |
25.88 (-0.38%) |
25.93 |
25.60 - 25.97 |
0.7011 times |
Fri 28 February 2025 |
25.98 (2%) |
25.43 |
25.30 - 25.98 |
0.7044 times |
Fri 31 January 2025 |
25.47 (0.43%) |
25.37 |
25.01 - 25.62 |
0.5873 times |
Tue 31 December 2024 |
25.36 (-1.86%) |
26.04 |
25.18 - 26.04 |
0.5772 times |

DMA SMA EMA moving averages of Spdr Ssga FISR
DMA (daily moving average) of Spdr Ssga FISR
| DMA period | DMA value | | 5 day DMA | 26.32 | | 12 day DMA | 26.23 | | 20 day DMA | 26.16 | | 35 day DMA | 26.12 | | 50 day DMA | 26.03 | | 100 day DMA | 25.81 | | 150 day DMA | 25.73 | | 200 day DMA | 25.68 | EMA (exponential moving average) of Spdr Ssga FISR
| EMA period | EMA current | EMA prev | EMA prev2 | | 5 day EMA | 26.3 | 26.29 | 26.3 | | 12 day EMA | 26.24 | 26.23 | 26.22 | | 20 day EMA | 26.19 | 26.18 | 26.17 | | 35 day EMA | 26.11 | 26.1 | 26.09 | | 50 day EMA | 26.03 | 26.02 | 26.01 |
SMA (simple moving average) of Spdr Ssga FISR
| SMA period | SMA current | SMA prev | SMA prev2 | | 5 day SMA | 26.32 | 26.31 | 26.31 | | 12 day SMA | 26.23 | 26.21 | 26.19 | | 20 day SMA | 26.16 | 26.14 | 26.13 | | 35 day SMA | 26.12 | 26.11 | 26.1 | | 50 day SMA | 26.03 | 26.02 | 26.01 | | 100 day SMA | 25.81 | 25.8 | 25.79 | | 150 day SMA | 25.73 | 25.73 | 25.72 | | 200 day SMA | 25.68 | 25.67 | 25.67 |
|
|
