FidelityInternational FIDI full analysis,charts,indicators,moving averages,SMA,DMA,EMA,ADX,MACD,RSIFidelity International FIDI WideScreen charts, DMA,SMA,EMA technical analysis, forecast prediction, by indicators ADX,MACD,RSI,CCI AMEX stock exchange
Daily price and charts and targets FidelityInternational Strong Daily Stock price targets for FidelityInternational FIDI are 24.67 and 24.82 | Daily Target 1 | 24.56 | | Daily Target 2 | 24.62 | | Daily Target 3 | 24.71 | | Daily Target 4 | 24.77 | | Daily Target 5 | 24.86 |
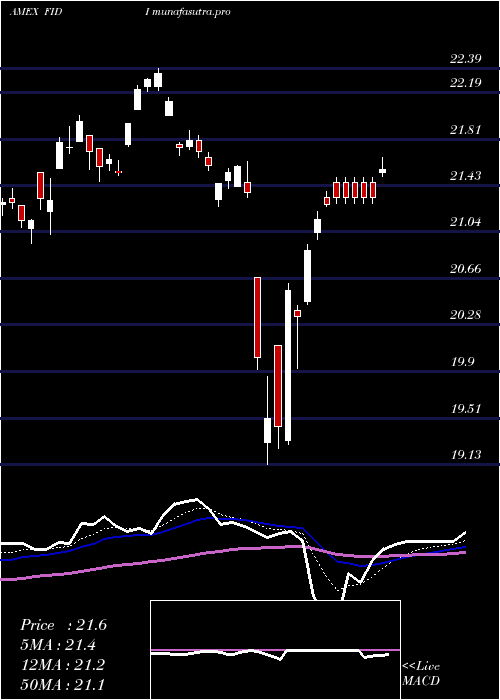
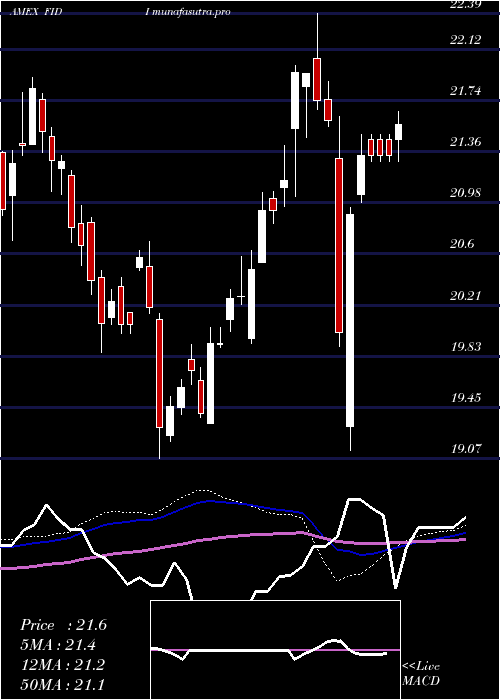
Daily price and volume Fidelity International
| Date |
Closing |
Open |
Range |
Volume |
Thu 23 October 2025 |
24.68 (0.08%) |
24.66 |
24.65 - 24.80 |
0.7598 times |
Wed 22 October 2025 |
24.66 (0.2%) |
24.56 |
24.56 - 24.70 |
0.5429 times |
Tue 21 October 2025 |
24.61 (-0.61%) |
24.75 |
24.59 - 24.75 |
1.1399 times |
Mon 20 October 2025 |
24.76 (0.28%) |
24.71 |
24.70 - 24.79 |
1.0593 times |
Fri 17 October 2025 |
24.69 (0.04%) |
24.60 |
24.57 - 24.73 |
0.7168 times |
Thu 16 October 2025 |
24.68 (0.16%) |
24.55 |
24.55 - 24.82 |
1.4162 times |
Wed 15 October 2025 |
24.64 (0.45%) |
24.67 |
24.52 - 24.70 |
0.8063 times |
Tue 14 October 2025 |
24.53 (0.66%) |
24.26 |
24.26 - 24.61 |
0.8089 times |
Mon 13 October 2025 |
24.37 (0.45%) |
24.40 |
24.30 - 24.44 |
1.3999 times |
Fri 10 October 2025 |
24.26 (-1.06%) |
24.58 |
24.23 - 24.58 |
1.35 times |
Thu 09 October 2025 |
24.52 (-0.49%) |
24.73 |
24.47 - 24.74 |
1.0847 times |
Weekly price and charts FidelityInternational Strong weekly Stock price targets for FidelityInternational FIDI are 24.5 and 24.74 | Weekly Target 1 | 24.44 | | Weekly Target 2 | 24.56 | | Weekly Target 3 | 24.68 | | Weekly Target 4 | 24.8 | | Weekly Target 5 | 24.92 |
Weekly price and volumes for Fidelity International
| Date |
Closing |
Open |
Range |
Volume |
Thu 23 October 2025 |
24.68 (-0.04%) |
24.71 |
24.56 - 24.80 |
0.7142 times |
Fri 17 October 2025 |
24.69 (1.77%) |
24.40 |
24.26 - 24.82 |
1.05 times |
Fri 10 October 2025 |
24.26 (-2.26%) |
24.79 |
24.23 - 24.88 |
1.2578 times |
Fri 03 October 2025 |
24.82 (2.18%) |
24.34 |
24.33 - 25.15 |
0.9554 times |
Fri 26 September 2025 |
24.29 (0.08%) |
24.26 |
24.01 - 24.47 |
1.2251 times |
Fri 19 September 2025 |
24.27 (-1.46%) |
24.81 |
24.26 - 24.83 |
1.194 times |
Fri 12 September 2025 |
24.63 (0.9%) |
24.62 |
24.43 - 24.74 |
1.4999 times |
Fri 05 September 2025 |
24.41 (0.25%) |
24.11 |
23.92 - 24.61 |
0.8624 times |
Fri 29 August 2025 |
24.35 (0%) |
24.35 |
24.28 - 24.38 |
0.1939 times |
Fri 29 August 2025 |
24.35 (-2.01%) |
24.62 |
24.20 - 24.75 |
1.0472 times |
Fri 22 August 2025 |
24.85 (1.68%) |
24.38 |
24.27 - 24.88 |
1.2433 times |
Monthly price and charts FidelityInternational Strong monthly Stock price targets for FidelityInternational FIDI are 24.46 and 25.38 | Monthly Target 1 | 23.77 | | Monthly Target 2 | 24.22 | | Monthly Target 3 | 24.686666666667 | | Monthly Target 4 | 25.14 | | Monthly Target 5 | 25.61 |
Monthly price and volumes Fidelity International
| Date |
Closing |
Open |
Range |
Volume |
Thu 23 October 2025 |
24.68 (0.86%) |
24.56 |
24.23 - 25.15 |
0.7868 times |
Tue 30 September 2025 |
24.47 (0.49%) |
24.11 |
23.92 - 24.83 |
1.0946 times |
Fri 29 August 2025 |
24.35 (4.82%) |
23.24 |
23.12 - 24.88 |
1.2169 times |
Thu 31 July 2025 |
23.23 (-0.26%) |
23.26 |
23.13 - 24.12 |
1.2156 times |
Mon 30 June 2025 |
23.29 (0.04%) |
23.38 |
22.45 - 23.73 |
0.9008 times |
Fri 30 May 2025 |
23.28 (3.47%) |
22.50 |
22.30 - 23.39 |
1.1555 times |
Wed 30 April 2025 |
22.50 (4.94%) |
21.47 |
19.13 - 22.55 |
1.1507 times |
Mon 31 March 2025 |
21.44 (1.42%) |
21.53 |
21.02 - 22.39 |
1.1725 times |
Fri 28 February 2025 |
21.14 (4.24%) |
19.97 |
19.93 - 21.40 |
0.6571 times |
Fri 31 January 2025 |
20.28 (4%) |
19.55 |
19.33 - 20.58 |
0.6493 times |
Tue 31 December 2024 |
19.50 (-2.84%) |
20.49 |
19.07 - 20.69 |
0.5338 times |

DMA SMA EMA moving averages of Fidelity International FIDI
DMA (daily moving average) of Fidelity International FIDI
| DMA period | DMA value | | 5 day DMA | 24.68 | | 12 day DMA | 24.59 | | 20 day DMA | 24.58 | | 35 day DMA | 24.53 | | 50 day DMA | 24.49 | | 100 day DMA | 24 | | 150 day DMA | 23.33 | | 200 day DMA | 22.71 | EMA (exponential moving average) of Fidelity International FIDI
| EMA period | EMA current | EMA prev | EMA prev2 | | 5 day EMA | 24.66 | 24.65 | 24.65 | | 12 day EMA | 24.61 | 24.6 | 24.59 | | 20 day EMA | 24.59 | 24.58 | 24.57 | | 35 day EMA | 24.54 | 24.53 | 24.52 | | 50 day EMA | 24.5 | 24.49 | 24.48 |
SMA (simple moving average) of Fidelity International FIDI
| SMA period | SMA current | SMA prev | SMA prev2 | | 5 day SMA | 24.68 | 24.68 | 24.68 | | 12 day SMA | 24.59 | 24.58 | 24.59 | | 20 day SMA | 24.58 | 24.55 | 24.53 | | 35 day SMA | 24.53 | 24.52 | 24.51 | | 50 day SMA | 24.49 | 24.49 | 24.48 | | 100 day SMA | 24 | 23.99 | 23.97 | | 150 day SMA | 23.33 | 23.32 | 23.3 | | 200 day SMA | 22.71 | 22.68 | 22.66 |
|
|
