AmericanCentury FDG full analysis,charts,indicators,moving averages,SMA,DMA,EMA,ADX,MACD,RSIAmerican Century FDG WideScreen charts, DMA,SMA,EMA technical analysis, forecast prediction, by indicators ADX,MACD,RSI,CCI AMEX stock exchange
Daily price and charts and targets AmericanCentury Strong Daily Stock price targets for AmericanCentury FDG are 122.59 and 123.91 | Daily Target 1 | 121.51 | | Daily Target 2 | 122.35 | | Daily Target 3 | 122.83333333333 | | Daily Target 4 | 123.67 | | Daily Target 5 | 124.15 |
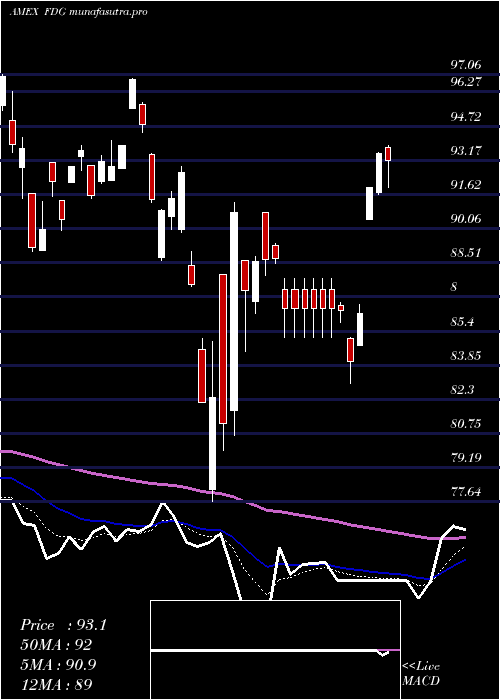
Daily price and volume American Century
| Date |
Closing |
Open |
Range |
Volume |
Thu 23 October 2025 |
123.18 (1.22%) |
122.00 |
122.00 - 123.32 |
0.3022 times |
Wed 22 October 2025 |
121.70 (-1.53%) |
122.22 |
121.00 - 122.31 |
0.4746 times |
Tue 21 October 2025 |
123.59 (-0.25%) |
123.47 |
123.47 - 123.87 |
0.8145 times |
Mon 20 October 2025 |
123.90 (1.08%) |
123.45 |
123.45 - 124.12 |
0.5789 times |
Fri 17 October 2025 |
122.58 (0.59%) |
121.71 |
121.46 - 122.81 |
0.4984 times |
Thu 16 October 2025 |
121.86 (-0.11%) |
123.19 |
121.54 - 123.39 |
2.8144 times |
Wed 15 October 2025 |
122.00 (0.19%) |
122.72 |
121.09 - 123.77 |
0.8991 times |
Tue 14 October 2025 |
121.77 (-0.77%) |
120.16 |
120.11 - 122.66 |
1.0261 times |
Mon 13 October 2025 |
122.71 (0.88%) |
121.83 |
121.83 - 122.90 |
1.079 times |
Fri 10 October 2025 |
121.64 (-2.12%) |
124.96 |
121.39 - 125.23 |
1.5127 times |
Thu 09 October 2025 |
124.27 (0.29%) |
124.17 |
123.62 - 124.45 |
0.878 times |
Weekly price and charts AmericanCentury Strong weekly Stock price targets for AmericanCentury FDG are 120.53 and 123.65 | Weekly Target 1 | 119.65 | | Weekly Target 2 | 121.41 | | Weekly Target 3 | 122.76666666667 | | Weekly Target 4 | 124.53 | | Weekly Target 5 | 125.89 |
Weekly price and volumes for American Century
| Date |
Closing |
Open |
Range |
Volume |
Thu 23 October 2025 |
123.18 (0.49%) |
123.45 |
121.00 - 124.12 |
0.5594 times |
Fri 17 October 2025 |
122.58 (0.77%) |
121.83 |
120.11 - 123.77 |
1.6283 times |
Fri 10 October 2025 |
121.64 (-0.06%) |
123.08 |
121.39 - 125.23 |
1.3899 times |
Fri 03 October 2025 |
121.71 (1.93%) |
120.34 |
119.58 - 122.19 |
1.0401 times |
Fri 26 September 2025 |
119.40 (-1.68%) |
121.39 |
118.12 - 122.50 |
1.6987 times |
Fri 19 September 2025 |
121.44 (1.93%) |
119.02 |
119.02 - 121.56 |
1.1479 times |
Fri 12 September 2025 |
119.14 (1.97%) |
116.85 |
116.85 - 119.17 |
0.8698 times |
Fri 05 September 2025 |
116.84 (1.21%) |
113.28 |
112.67 - 116.87 |
0.6707 times |
Fri 29 August 2025 |
115.44 (0%) |
115.19 |
115.02 - 115.51 |
0.1363 times |
Fri 29 August 2025 |
115.44 (-0.11%) |
116.01 |
115.02 - 116.98 |
0.8589 times |
Fri 22 August 2025 |
115.57 (0.25%) |
115.27 |
111.92 - 116.20 |
0.818 times |
Monthly price and charts AmericanCentury Strong monthly Stock price targets for AmericanCentury FDG are 121.65 and 126.77 | Monthly Target 1 | 117.72 | | Monthly Target 2 | 120.45 | | Monthly Target 3 | 122.84 | | Monthly Target 4 | 125.57 | | Monthly Target 5 | 127.96 |
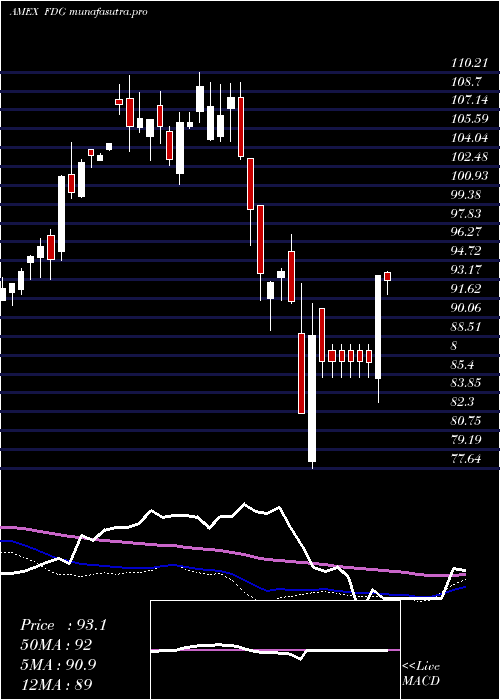
Monthly price and volumes American Century
| Date |
Closing |
Open |
Range |
Volume |
Thu 23 October 2025 |
123.18 (2.27%) |
120.75 |
120.11 - 125.23 |
0.4352 times |
Tue 30 September 2025 |
120.44 (4.33%) |
113.28 |
112.67 - 122.50 |
0.4747 times |
Fri 29 August 2025 |
115.44 (1.09%) |
110.40 |
110.40 - 116.98 |
1.1368 times |
Thu 31 July 2025 |
114.20 (4.52%) |
108.48 |
107.31 - 115.71 |
0.8265 times |
Mon 30 June 2025 |
109.26 (6.91%) |
102.50 |
101.86 - 109.26 |
0.7517 times |
Fri 30 May 2025 |
102.20 (9.08%) |
94.95 |
94.95 - 104.78 |
0.7676 times |
Wed 30 April 2025 |
93.69 (3.11%) |
90.62 |
77.64 - 94.57 |
1.7186 times |
Mon 31 March 2025 |
90.86 (-8.17%) |
99.26 |
88.63 - 99.26 |
1.1433 times |
Fri 28 February 2025 |
98.94 (-7.87%) |
104.98 |
96.01 - 109.42 |
1.2774 times |
Fri 31 January 2025 |
107.39 (3.4%) |
104.67 |
101.01 - 110.21 |
1.4681 times |
Tue 31 December 2024 |
103.86 (0.44%) |
103.87 |
103.71 - 109.95 |
1.479 times |

DMA SMA EMA moving averages of American Century FDG
DMA (daily moving average) of American Century FDG
| DMA period | DMA value | | 5 day DMA | 122.99 | | 12 day DMA | 122.76 | | 20 day DMA | 122.18 | | 35 day DMA | 121.01 | | 50 day DMA | 119.29 | | 100 day DMA | 114.34 | | 150 day DMA | 107.46 | | 200 day DMA | 106.06 | EMA (exponential moving average) of American Century FDG
| EMA period | EMA current | EMA prev | EMA prev2 | | 5 day EMA | 122.81 | 122.62 | 123.08 | | 12 day EMA | 122.55 | 122.43 | 122.56 | | 20 day EMA | 122.03 | 121.91 | 121.93 | | 35 day EMA | 120.68 | 120.53 | 120.46 | | 50 day EMA | 119.31 | 119.15 | 119.05 |
SMA (simple moving average) of American Century FDG
| SMA period | SMA current | SMA prev | SMA prev2 | | 5 day SMA | 122.99 | 122.73 | 122.79 | | 12 day SMA | 122.76 | 122.71 | 122.82 | | 20 day SMA | 122.18 | 121.96 | 121.89 | | 35 day SMA | 121.01 | 120.82 | 120.63 | | 50 day SMA | 119.29 | 119.13 | 119 | | 100 day SMA | 114.34 | 114.13 | 113.94 | | 150 day SMA | 107.46 | 107.27 | 107.08 | | 200 day SMA | 106.06 | 105.98 | 105.9 |
|
|
