AberdeenGlobal FCO full analysis,charts,indicators,moving averages,SMA,DMA,EMA,ADX,MACD,RSIAberdeen Global FCO WideScreen charts, DMA,SMA,EMA technical analysis, forecast prediction, by indicators ADX,MACD,RSI,CCI AMEX stock exchange
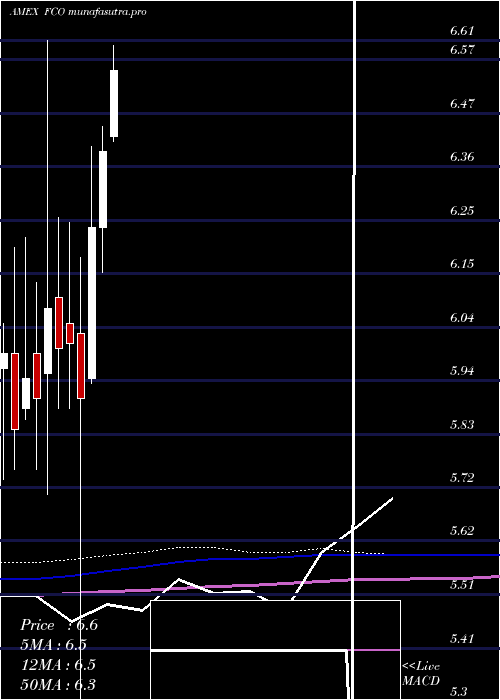
Daily price and charts and targets AberdeenGlobal Strong Daily Stock price targets for AberdeenGlobal FCO are 3 and 3.06 | Daily Target 1 | 2.99 | | Daily Target 2 | 3.01 | | Daily Target 3 | 3.0466666666667 | | Daily Target 4 | 3.07 | | Daily Target 5 | 3.11 |
Daily price and volume Aberdeen Global
| Date |
Closing |
Open |
Range |
Volume |
Thu 23 October 2025 |
3.04 (0.33%) |
3.06 |
3.02 - 3.08 |
1.0886 times |
Wed 22 October 2025 |
3.03 (2.36%) |
2.95 |
2.93 - 3.09 |
1.7252 times |
Tue 21 October 2025 |
2.96 (2.78%) |
2.87 |
2.87 - 2.98 |
0.8182 times |
Mon 20 October 2025 |
2.88 (0.7%) |
2.87 |
2.85 - 2.94 |
0.9418 times |
Fri 17 October 2025 |
2.86 (0.7%) |
2.86 |
2.83 - 2.88 |
0.6277 times |
Thu 16 October 2025 |
2.84 (0.35%) |
2.85 |
2.83 - 2.87 |
1.0855 times |
Wed 15 October 2025 |
2.83 (0.35%) |
2.82 |
2.82 - 2.89 |
1.131 times |
Tue 14 October 2025 |
2.82 (-2.08%) |
2.87 |
2.81 - 2.90 |
1.6548 times |
Mon 13 October 2025 |
2.88 (-1.37%) |
2.90 |
2.88 - 2.95 |
0.6651 times |
Tue 07 October 2025 |
2.92 (-0.34%) |
2.90 |
2.90 - 2.94 |
0.2621 times |
Mon 06 October 2025 |
2.93 (1.38%) |
2.90 |
2.90 - 2.94 |
0.519 times |
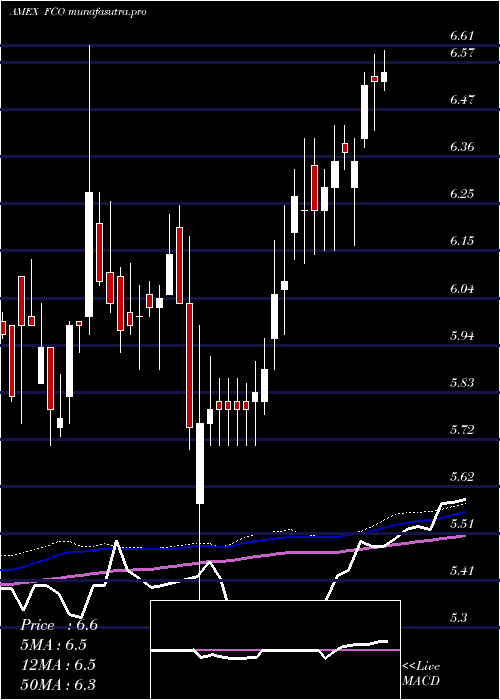
Weekly price and charts AberdeenGlobal Strong weekly Stock price targets for AberdeenGlobal FCO are 2.95 and 3.19 | Weekly Target 1 | 2.75 | | Weekly Target 2 | 2.9 | | Weekly Target 3 | 2.9933333333333 | | Weekly Target 4 | 3.14 | | Weekly Target 5 | 3.23 |
Weekly price and volumes for Aberdeen Global
| Date |
Closing |
Open |
Range |
Volume |
Thu 23 October 2025 |
3.04 (6.29%) |
2.87 |
2.85 - 3.09 |
0.9397 times |
Fri 17 October 2025 |
2.86 (-2.05%) |
2.90 |
2.81 - 2.95 |
1.061 times |
Tue 07 October 2025 |
2.92 (1.04%) |
2.90 |
2.90 - 2.94 |
0.1605 times |
Fri 03 October 2025 |
2.89 (-5.25%) |
3.07 |
2.88 - 3.13 |
1.478 times |
Fri 26 September 2025 |
3.05 (-7.58%) |
3.29 |
3.01 - 3.32 |
1.1622 times |
Fri 19 September 2025 |
3.30 (-5.17%) |
3.36 |
3.18 - 3.45 |
1.9719 times |
Fri 12 September 2025 |
3.48 (-47.67%) |
6.67 |
3.43 - 6.77 |
2.7583 times |
Fri 05 September 2025 |
6.65 (-0.75%) |
6.70 |
6.60 - 6.70 |
0.1853 times |
Fri 29 August 2025 |
6.70 (0%) |
6.67 |
6.65 - 6.71 |
0.0624 times |
Fri 29 August 2025 |
6.70 (0.15%) |
6.68 |
6.60 - 6.71 |
0.2207 times |
Fri 22 August 2025 |
6.69 (0.45%) |
6.69 |
6.65 - 6.73 |
0.3183 times |
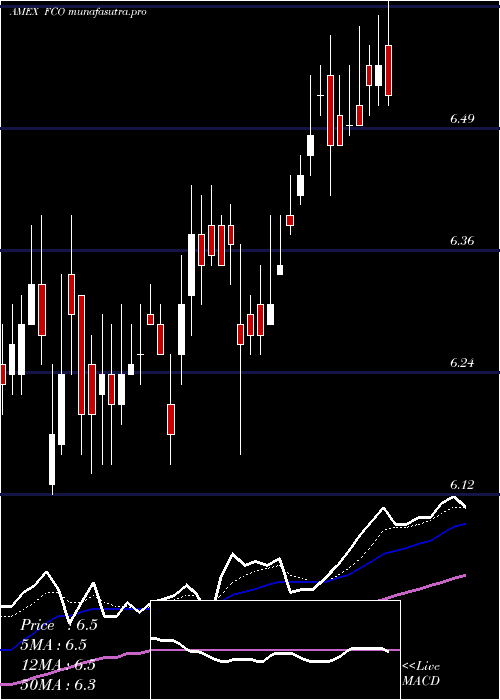
Monthly price and charts AberdeenGlobal Strong monthly Stock price targets for AberdeenGlobal FCO are 2.93 and 3.21 | Monthly Target 1 | 2.7 | | Monthly Target 2 | 2.87 | | Monthly Target 3 | 2.98 | | Monthly Target 4 | 3.15 | | Monthly Target 5 | 3.26 |
Monthly price and volumes Aberdeen Global
| Date |
Closing |
Open |
Range |
Volume |
Thu 23 October 2025 |
3.04 (2.01%) |
2.96 |
2.81 - 3.09 |
1.3375 times |
Tue 30 September 2025 |
2.98 (-55.52%) |
6.70 |
2.94 - 6.77 |
2.9341 times |
Fri 29 August 2025 |
6.70 (2.92%) |
6.47 |
6.43 - 6.73 |
0.5891 times |
Thu 31 July 2025 |
6.51 (1.88%) |
6.42 |
6.33 - 6.65 |
0.6933 times |
Mon 30 June 2025 |
6.39 (2.4%) |
6.24 |
6.15 - 6.44 |
0.6726 times |
Fri 30 May 2025 |
6.24 (5.76%) |
5.94 |
5.93 - 6.40 |
0.8257 times |
Wed 30 April 2025 |
5.90 (-1.83%) |
6.03 |
5.30 - 6.18 |
0.7345 times |
Mon 31 March 2025 |
6.01 (0.17%) |
6.05 |
5.88 - 6.25 |
0.5697 times |
Fri 28 February 2025 |
6.00 (-1.32%) |
6.10 |
5.88 - 6.26 |
0.6798 times |
Fri 31 January 2025 |
6.08 (3.05%) |
5.95 |
5.71 - 6.61 |
0.9636 times |
Tue 31 December 2024 |
5.90 (-0.67%) |
5.99 |
5.76 - 6.13 |
0.4133 times |
DMA SMA EMA moving averages of Aberdeen Global FCO
DMA (daily moving average) of Aberdeen Global FCO
| DMA period | DMA value | | 5 day DMA | 2.95 | | 12 day DMA | 2.91 | | 20 day DMA | 2.95 | | 35 day DMA | 3.84 | | 50 day DMA | 4.69 | | 100 day DMA | 5.55 | | 150 day DMA | 5.7 | | 200 day DMA | 5.78 | EMA (exponential moving average) of Aberdeen Global FCO
| EMA period | EMA current | EMA prev | EMA prev2 | | 5 day EMA | 2.97 | 2.94 | 2.9 | | 12 day EMA | 2.99 | 2.98 | 2.97 | | 20 day EMA | 3.2 | 3.22 | 3.24 | | 35 day EMA | 3.9 | 3.95 | 4 | | 50 day EMA | 4.66 | 4.73 | 4.8 |
SMA (simple moving average) of Aberdeen Global FCO
| SMA period | SMA current | SMA prev | SMA prev2 | | 5 day SMA | 2.95 | 2.91 | 2.87 | | 12 day SMA | 2.91 | 2.9 | 2.89 | | 20 day SMA | 2.95 | 2.96 | 2.98 | | 35 day SMA | 3.84 | 3.94 | 4.05 | | 50 day SMA | 4.69 | 4.76 | 4.83 | | 100 day SMA | 5.55 | 5.58 | 5.61 | | 150 day SMA | 5.7 | 5.72 | 5.74 | | 200 day SMA | 5.78 | 5.79 | 5.81 |
|
|
