FidelityBlue FBCG full analysis,charts,indicators,moving averages,SMA,DMA,EMA,ADX,MACD,RSIFidelity Blue FBCG WideScreen charts, DMA,SMA,EMA technical analysis, forecast prediction, by indicators ADX,MACD,RSI,CCI AMEX stock exchange
Daily price and charts and targets FidelityBlue Strong Daily Stock price targets for FidelityBlue FBCG are 53.3 and 53.97 | Daily Target 1 | 52.76 | | Daily Target 2 | 53.17 | | Daily Target 3 | 53.433333333333 | | Daily Target 4 | 53.84 | | Daily Target 5 | 54.1 |
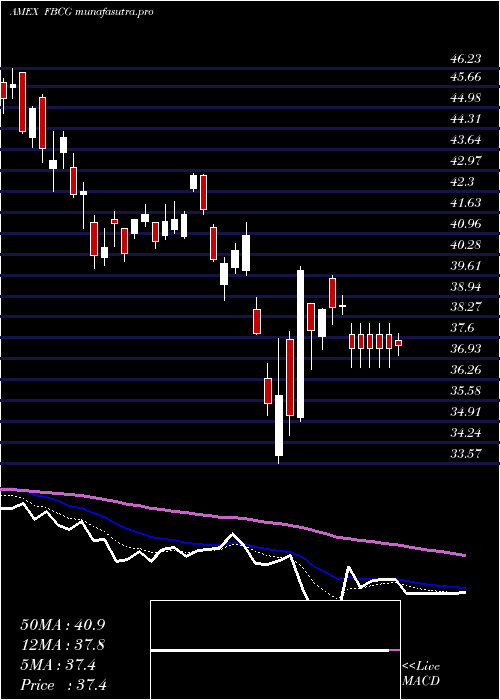
Daily price and volume Fidelity Blue
| Date |
Closing |
Open |
Range |
Volume |
Thu 23 October 2025 |
53.57 (1.17%) |
53.03 |
53.03 - 53.70 |
1.0288 times |
Wed 22 October 2025 |
52.95 (-1.1%) |
53.44 |
52.37 - 53.55 |
1.1992 times |
Tue 21 October 2025 |
53.54 (-0.15%) |
53.61 |
53.38 - 53.74 |
0.9927 times |
Mon 20 October 2025 |
53.62 (0.98%) |
53.30 |
53.18 - 53.78 |
0.942 times |
Fri 17 October 2025 |
53.10 (0.13%) |
52.71 |
52.43 - 53.23 |
0.8949 times |
Thu 16 October 2025 |
53.03 (-0.28%) |
53.49 |
52.60 - 53.73 |
0.9769 times |
Wed 15 October 2025 |
53.18 (0.64%) |
53.44 |
52.62 - 53.63 |
1.3524 times |
Tue 14 October 2025 |
52.84 (-1.12%) |
52.72 |
52.03 - 53.33 |
0.8133 times |
Mon 13 October 2025 |
53.44 (-0.15%) |
53.23 |
53.00 - 53.49 |
0.8043 times |
Tue 07 October 2025 |
53.52 (-0.52%) |
53.94 |
53.33 - 54.01 |
0.9955 times |
Mon 06 October 2025 |
53.80 (0.19%) |
54.14 |
53.65 - 54.15 |
0.724 times |
Weekly price and charts FidelityBlue Strong weekly Stock price targets for FidelityBlue FBCG are 52.97 and 54.38 | Weekly Target 1 | 51.83 | | Weekly Target 2 | 52.7 | | Weekly Target 3 | 53.24 | | Weekly Target 4 | 54.11 | | Weekly Target 5 | 54.65 |
Weekly price and volumes for Fidelity Blue
| Date |
Closing |
Open |
Range |
Volume |
Thu 23 October 2025 |
53.57 (0.89%) |
53.30 |
52.37 - 53.78 |
1.0848 times |
Fri 17 October 2025 |
53.10 (-0.78%) |
53.23 |
52.03 - 53.73 |
1.2617 times |
Tue 07 October 2025 |
53.52 (-0.34%) |
54.14 |
53.33 - 54.15 |
0.4481 times |
Fri 03 October 2025 |
53.70 (1%) |
53.49 |
53.16 - 54.21 |
1.3087 times |
Fri 26 September 2025 |
53.17 (-1.23%) |
53.82 |
52.37 - 54.33 |
1.1157 times |
Fri 19 September 2025 |
53.83 (2.24%) |
52.85 |
52.44 - 53.96 |
1.0082 times |
Fri 12 September 2025 |
52.65 (2.49%) |
51.76 |
51.69 - 52.88 |
1.3313 times |
Fri 05 September 2025 |
51.37 (0.77%) |
50.08 |
49.76 - 51.97 |
1.2512 times |
Fri 29 August 2025 |
50.98 (0%) |
51.51 |
50.78 - 51.51 |
0.1718 times |
Fri 29 August 2025 |
50.98 (-0.2%) |
50.95 |
50.78 - 51.94 |
1.0185 times |
Fri 22 August 2025 |
51.08 (-0.91%) |
51.46 |
49.33 - 51.65 |
1.1997 times |

Monthly price and charts FidelityBlue Strong monthly Stock price targets for FidelityBlue FBCG are 52.8 and 54.98 | Monthly Target 1 | 51.09 | | Monthly Target 2 | 52.33 | | Monthly Target 3 | 53.27 | | Monthly Target 4 | 54.51 | | Monthly Target 5 | 55.45 |
Monthly price and volumes Fidelity Blue
| Date |
Closing |
Open |
Range |
Volume |
Thu 23 October 2025 |
53.57 (-0.17%) |
53.22 |
52.03 - 54.21 |
0.5955 times |
Tue 30 September 2025 |
53.66 (5.26%) |
50.08 |
49.76 - 54.33 |
0.8001 times |
Fri 29 August 2025 |
50.98 (1.25%) |
49.52 |
48.86 - 51.98 |
0.7861 times |
Thu 31 July 2025 |
50.35 (4.37%) |
48.09 |
47.49 - 51.20 |
0.7874 times |
Mon 30 June 2025 |
48.24 (8.11%) |
44.40 |
44.20 - 48.35 |
0.734 times |
Fri 30 May 2025 |
44.62 (10.75%) |
41.20 |
40.52 - 45.41 |
0.9763 times |
Wed 30 April 2025 |
40.29 (0.8%) |
39.87 |
33.57 - 41.31 |
1.6327 times |
Mon 31 March 2025 |
39.97 (-11.06%) |
45.31 |
38.81 - 45.39 |
1.3951 times |
Fri 28 February 2025 |
44.94 (-5.19%) |
46.11 |
43.70 - 48.79 |
0.8936 times |
Fri 31 January 2025 |
47.40 (2.46%) |
46.72 |
45.39 - 48.84 |
1.3992 times |
Tue 31 December 2024 |
46.26 (0.87%) |
46.57 |
45.94 - 48.41 |
0.821 times |

DMA SMA EMA moving averages of Fidelity Blue FBCG
DMA (daily moving average) of Fidelity Blue FBCG
| DMA period | DMA value | | 5 day DMA | 53.36 | | 12 day DMA | 53.36 | | 20 day DMA | 53.4 | | 35 day DMA | 53.02 | | 50 day DMA | 52.46 | | 100 day DMA | 50.22 | | 150 day DMA | 46.98 | | 200 day DMA | 46.74 | EMA (exponential moving average) of Fidelity Blue FBCG
| EMA period | EMA current | EMA prev | EMA prev2 | | 5 day EMA | 53.35 | 53.24 | 53.39 | | 12 day EMA | 53.34 | 53.3 | 53.36 | | 20 day EMA | 53.24 | 53.2 | 53.23 | | 35 day EMA | 52.83 | 52.79 | 52.78 | | 50 day EMA | 52.41 | 52.36 | 52.34 |
SMA (simple moving average) of Fidelity Blue FBCG
| SMA period | SMA current | SMA prev | SMA prev2 | | 5 day SMA | 53.36 | 53.25 | 53.29 | | 12 day SMA | 53.36 | 53.39 | 53.45 | | 20 day SMA | 53.4 | 53.44 | 53.48 | | 35 day SMA | 53.02 | 52.95 | 52.89 | | 50 day SMA | 52.46 | 52.41 | 52.38 | | 100 day SMA | 50.22 | 50.13 | 50.04 | | 150 day SMA | 46.98 | 46.9 | 46.82 | | 200 day SMA | 46.74 | 46.71 | 46.68 |
|
|
