FinancialBear FAZ full analysis,charts,indicators,moving averages,SMA,DMA,EMA,ADX,MACD,RSIFinancial Bear FAZ WideScreen charts, DMA,SMA,EMA technical analysis, forecast prediction, by indicators ADX,MACD,RSI,CCI AMEX stock exchange
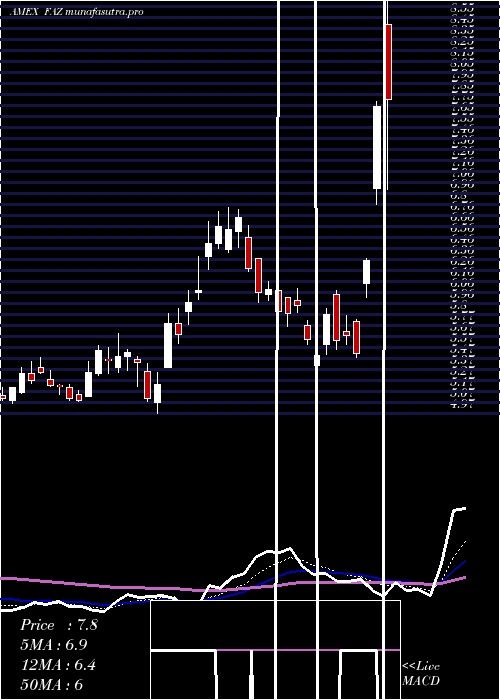
Daily price and charts and targets FinancialBear Strong Daily Stock price targets for FinancialBear FAZ are 41.33 and 42.69 | Daily Target 1 | 41.04 | | Daily Target 2 | 41.62 | | Daily Target 3 | 42.403333333333 | | Daily Target 4 | 42.98 | | Daily Target 5 | 43.76 |
Daily price and volume Financial Bear
| Date |
Closing |
Open |
Range |
Volume |
Fri 24 October 2025 |
42.19 (-3.23%) |
43.19 |
41.83 - 43.19 |
0.418 times |
Thu 23 October 2025 |
43.60 (-0.64%) |
43.80 |
43.24 - 44.21 |
0.3389 times |
Wed 22 October 2025 |
43.88 (1.81%) |
43.03 |
42.63 - 44.62 |
0.5777 times |
Tue 21 October 2025 |
43.10 (0.4%) |
43.16 |
42.16 - 43.30 |
0.4505 times |
Mon 20 October 2025 |
42.93 (-3.46%) |
44.05 |
42.68 - 44.18 |
0.5872 times |
Fri 17 October 2025 |
44.47 (-2.39%) |
47.62 |
44.01 - 47.82 |
1.3639 times |
Thu 16 October 2025 |
45.56 (8.68%) |
42.05 |
41.62 - 46.02 |
1.398 times |
Wed 15 October 2025 |
41.92 (0.05%) |
41.40 |
40.76 - 42.89 |
1.5749 times |
Tue 14 October 2025 |
41.90 (-3.74%) |
44.10 |
40.97 - 44.45 |
1.958 times |
Mon 13 October 2025 |
43.53 (-2.57%) |
43.64 |
43.02 - 44.19 |
1.3328 times |
Fri 10 October 2025 |
44.68 (6.58%) |
41.69 |
41.09 - 44.68 |
1.6731 times |
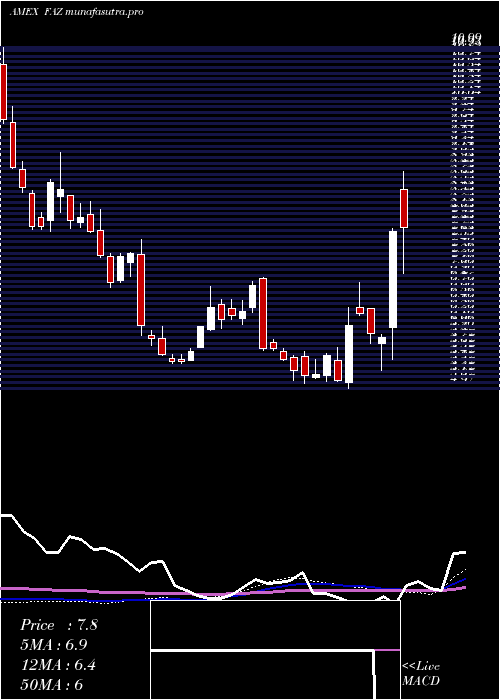
Weekly price and charts FinancialBear Strong weekly Stock price targets for FinancialBear FAZ are 40.62 and 43.41 | Weekly Target 1 | 40.09 | | Weekly Target 2 | 41.14 | | Weekly Target 3 | 42.88 | | Weekly Target 4 | 43.93 | | Weekly Target 5 | 45.67 |
Weekly price and volumes for Financial Bear
| Date |
Closing |
Open |
Range |
Volume |
Fri 24 October 2025 |
42.19 (-5.13%) |
44.05 |
41.83 - 44.62 |
0.046 times |
Fri 17 October 2025 |
44.47 (-0.47%) |
43.64 |
40.76 - 47.82 |
0.1478 times |
Fri 10 October 2025 |
44.68 (9.3%) |
40.41 |
40.12 - 44.68 |
0.0726 times |
Fri 03 October 2025 |
40.88 (909.38%) |
40.15 |
39.66 - 42.32 |
0.0557 times |
Fri 26 September 2025 |
4.05 (0.25%) |
4.10 |
3.90 - 4.19 |
2.2224 times |
Fri 19 September 2025 |
4.04 (-1.94%) |
4.10 |
3.96 - 4.25 |
2.4242 times |
Fri 12 September 2025 |
4.12 (-3.74%) |
4.29 |
4.05 - 4.34 |
1.7893 times |
Fri 05 September 2025 |
4.28 (5.42%) |
4.15 |
4.02 - 4.33 |
1.6563 times |
Fri 29 August 2025 |
4.06 (0%) |
4.09 |
4.03 - 4.11 |
0.3291 times |
Fri 29 August 2025 |
4.06 (-2.4%) |
4.19 |
4.03 - 4.26 |
1.2567 times |
Fri 22 August 2025 |
4.16 (-5.67%) |
4.44 |
4.12 - 4.46 |
2.3024 times |
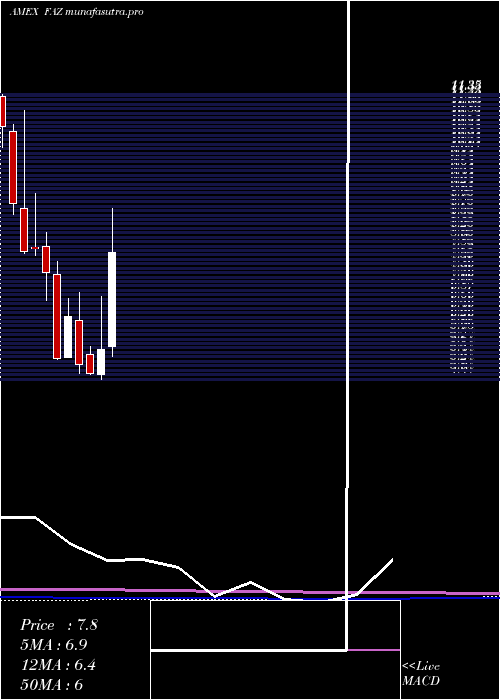
Monthly price and charts FinancialBear Strong monthly Stock price targets for FinancialBear FAZ are 41.16 and 48.86 | Monthly Target 1 | 35.68 | | Monthly Target 2 | 38.93 | | Monthly Target 3 | 43.376666666667 | | Monthly Target 4 | 46.63 | | Monthly Target 5 | 51.08 |
Monthly price and volumes Financial Bear
| Date |
Closing |
Open |
Range |
Volume |
Fri 24 October 2025 |
42.19 (4.33%) |
41.15 |
40.12 - 47.82 |
0.0364 times |
Tue 30 September 2025 |
40.44 (896.06%) |
4.15 |
3.90 - 41.47 |
0.9863 times |
Fri 29 August 2025 |
4.06 (-8.35%) |
4.59 |
4.03 - 4.77 |
1.1407 times |
Thu 31 July 2025 |
4.43 (0.91%) |
4.44 |
4.15 - 4.68 |
1.2928 times |
Mon 30 June 2025 |
4.39 (-9.3%) |
4.93 |
4.38 - 5.18 |
1.0064 times |
Fri 30 May 2025 |
4.84 (-12%) |
5.54 |
4.60 - 5.61 |
0.903 times |
Wed 30 April 2025 |
5.50 (-2.31%) |
5.71 |
5.44 - 8.79 |
1.3926 times |
Mon 31 March 2025 |
5.63 (10.39%) |
5.07 |
4.97 - 6.83 |
1.4319 times |
Fri 28 February 2025 |
5.10 (-3.59%) |
5.53 |
5.06 - 5.69 |
0.96 times |
Fri 31 January 2025 |
5.29 (-16.95%) |
6.28 |
5.10 - 6.92 |
0.8498 times |
Tue 31 December 2024 |
6.37 (17.1%) |
5.46 |
5.46 - 6.77 |
0.464 times |
DMA SMA EMA moving averages of Financial Bear FAZ
DMA (daily moving average) of Financial Bear FAZ
| DMA period | DMA value | | 5 day DMA | 43.14 | | 12 day DMA | 43.31 | | 20 day DMA | 42.37 | | 35 day DMA | 25.98 | | 50 day DMA | 19.44 | | 100 day DMA | 11.99 | | 150 day DMA | 9.88 | | 200 day DMA | 8.83 | EMA (exponential moving average) of Financial Bear FAZ
| EMA period | EMA current | EMA prev | EMA prev2 | | 5 day EMA | 43.08 | 43.53 | 43.5 | | 12 day EMA | 41.67 | 41.58 | 41.21 | | 20 day EMA | 37.62 | 37.14 | 36.46 | | 35 day EMA | 30.42 | 29.73 | 28.91 | | 50 day EMA | 20.57 | 19.69 | 18.71 |
SMA (simple moving average) of Financial Bear FAZ
| SMA period | SMA current | SMA prev | SMA prev2 | | 5 day SMA | 43.14 | 43.6 | 43.99 | | 12 day SMA | 43.31 | 43.25 | 43.01 | | 20 day SMA | 42.37 | 40.47 | 38.49 | | 35 day SMA | 25.98 | 24.9 | 23.77 | | 50 day SMA | 19.44 | 18.69 | 17.9 | | 100 day SMA | 11.99 | 11.62 | 11.23 | | 150 day SMA | 9.88 | 9.64 | 9.39 | | 200 day SMA | 8.83 | 8.65 | 8.47 |
|
|
