FinancialBull FAS full analysis,charts,indicators,moving averages,SMA,DMA,EMA,ADX,MACD,RSIFinancial Bull FAS WideScreen charts, DMA,SMA,EMA technical analysis, forecast prediction, by indicators ADX,MACD,RSI,CCI AMEX stock exchange
Daily price and charts and targets FinancialBull Strong Daily Stock price targets for FinancialBull FAS are 166.22 and 171.92 | Daily Target 1 | 161.71 | | Daily Target 2 | 165.03 | | Daily Target 3 | 167.41333333333 | | Daily Target 4 | 170.73 | | Daily Target 5 | 173.11 |
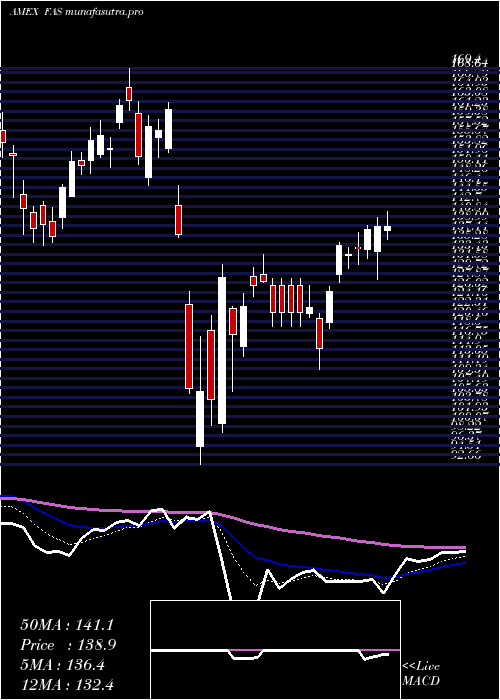
Daily price and volume Financial Bull
| Date |
Closing |
Open |
Range |
Volume |
Fri 24 October 2025 |
168.34 (3.15%) |
164.10 |
164.10 - 169.80 |
0.7349 times |
Thu 23 October 2025 |
163.20 (0.68%) |
162.21 |
160.81 - 164.40 |
0.4004 times |
Wed 22 October 2025 |
162.10 (-1.69%) |
165.50 |
159.22 - 165.50 |
0.7873 times |
Tue 21 October 2025 |
164.88 (-0.45%) |
164.70 |
163.98 - 168.63 |
0.5763 times |
Mon 20 October 2025 |
165.63 (3.4%) |
162.44 |
161.12 - 166.55 |
0.6544 times |
Fri 17 October 2025 |
160.19 (2.39%) |
148.65 |
148.65 - 161.68 |
1.0826 times |
Thu 16 October 2025 |
156.45 (-8.34%) |
171.75 |
154.42 - 171.77 |
1.5731 times |
Wed 15 October 2025 |
170.68 (-0.08%) |
173.61 |
166.98 - 175.73 |
1.285 times |
Tue 14 October 2025 |
170.81 (3.16%) |
162.62 |
161.36 - 174.66 |
1.6661 times |
Mon 13 October 2025 |
165.58 (2.85%) |
164.49 |
162.50 - 166.79 |
1.2399 times |
Fri 10 October 2025 |
160.99 (-6.48%) |
173.47 |
160.82 - 175.41 |
2.2765 times |
Weekly price and charts FinancialBull Strong weekly Stock price targets for FinancialBull FAS are 163.78 and 174.36 | Weekly Target 1 | 155.21 | | Weekly Target 2 | 161.77 | | Weekly Target 3 | 165.78666666667 | | Weekly Target 4 | 172.35 | | Weekly Target 5 | 176.37 |
Weekly price and volumes for Financial Bull
| Date |
Closing |
Open |
Range |
Volume |
Fri 24 October 2025 |
168.34 (5.09%) |
162.44 |
159.22 - 169.80 |
0.8337 times |
Fri 17 October 2025 |
160.19 (-0.5%) |
164.49 |
148.65 - 175.73 |
1.8102 times |
Fri 10 October 2025 |
160.99 (-8.74%) |
178.22 |
160.82 - 179.60 |
1.4509 times |
Fri 03 October 2025 |
176.40 (-0.98%) |
180.00 |
170.16 - 181.69 |
0.9928 times |
Fri 26 September 2025 |
178.14 (-1.43%) |
177.52 |
172.40 - 184.74 |
0.7143 times |
Fri 19 September 2025 |
180.73 (2.07%) |
177.86 |
171.73 - 183.68 |
1.1059 times |
Fri 12 September 2025 |
177.06 (3.85%) |
170.84 |
168.14 - 179.78 |
1.0724 times |
Fri 05 September 2025 |
170.49 (-5.29%) |
176.95 |
168.50 - 182.16 |
1.0409 times |
Fri 29 August 2025 |
180.01 (0%) |
179.00 |
178.24 - 181.53 |
0.1675 times |
Fri 29 August 2025 |
180.01 (2.09%) |
175.58 |
171.74 - 181.53 |
0.8113 times |
Fri 22 August 2025 |
176.32 (6.11%) |
165.43 |
164.56 - 177.44 |
0.9236 times |

Monthly price and charts FinancialBull Strong monthly Stock price targets for FinancialBull FAS are 143.02 and 173.97 | Monthly Target 1 | 134.58 | | Monthly Target 2 | 151.46 | | Monthly Target 3 | 165.53 | | Monthly Target 4 | 182.41 | | Monthly Target 5 | 196.48 |
Monthly price and volumes Financial Bull
| Date |
Closing |
Open |
Range |
Volume |
Fri 24 October 2025 |
168.34 (-5.37%) |
175.82 |
148.65 - 179.60 |
0.8041 times |
Tue 30 September 2025 |
177.90 (-1.17%) |
176.95 |
168.14 - 184.74 |
0.7343 times |
Fri 29 August 2025 |
180.01 (8.2%) |
160.63 |
153.93 - 181.53 |
0.6934 times |
Thu 31 July 2025 |
166.37 (-1.32%) |
167.79 |
157.75 - 177.73 |
0.9285 times |
Mon 30 June 2025 |
168.60 (8.06%) |
153.34 |
145.17 - 169.32 |
0.9104 times |
Fri 30 May 2025 |
156.02 (12.42%) |
138.00 |
136.33 - 165.08 |
0.9055 times |
Wed 30 April 2025 |
138.78 (-12.24%) |
156.18 |
92.66 - 162.88 |
1.8084 times |
Mon 31 March 2025 |
158.13 (-14.33%) |
185.88 |
135.17 - 189.23 |
1.087 times |
Fri 28 February 2025 |
184.57 (2.82%) |
171.38 |
165.55 - 187.15 |
0.8974 times |
Fri 31 January 2025 |
179.51 (18.9%) |
153.08 |
138.22 - 185.39 |
1.2312 times |
Tue 31 December 2024 |
150.98 (-16.19%) |
178.50 |
143.37 - 179.00 |
0.6918 times |

DMA SMA EMA moving averages of Financial Bull FAS
DMA (daily moving average) of Financial Bull FAS
| DMA period | DMA value | | 5 day DMA | 164.83 | | 12 day DMA | 165.08 | | 20 day DMA | 169.48 | | 35 day DMA | 172.51 | | 50 day DMA | 173.1 | | 100 day DMA | 168.42 | | 150 day DMA | 159.53 | | 200 day DMA | 161.38 | EMA (exponential moving average) of Financial Bull FAS
| EMA period | EMA current | EMA prev | EMA prev2 | | 5 day EMA | 165.13 | 163.53 | 163.69 | | 12 day EMA | 166.27 | 165.89 | 166.38 | | 20 day EMA | 168.18 | 168.16 | 168.68 | | 35 day EMA | 169.94 | 170.03 | 170.43 | | 50 day EMA | 171.77 | 171.91 | 172.27 |
SMA (simple moving average) of Financial Bull FAS
| SMA period | SMA current | SMA prev | SMA prev2 | | 5 day SMA | 164.83 | 163.2 | 161.85 | | 12 day SMA | 165.08 | 165.59 | 166.71 | | 20 day SMA | 169.48 | 169.97 | 170.54 | | 35 day SMA | 172.51 | 172.57 | 173.07 | | 50 day SMA | 173.1 | 173.06 | 173.23 | | 100 day SMA | 168.42 | 168.3 | 168.23 | | 150 day SMA | 159.53 | 159.45 | 159.4 | | 200 day SMA | 161.38 | 161.3 | 161.24 |
|
|
