EmuIndex EZU full analysis,charts,indicators,moving averages,SMA,DMA,EMA,ADX,MACD,RSIEmu Index EZU WideScreen charts, DMA,SMA,EMA technical analysis, forecast prediction, by indicators ADX,MACD,RSI,CCI AMEX stock exchange
Daily price and charts and targets EmuIndex Strong Daily Stock price targets for EmuIndex EZU are 62.61 and 62.87 | Daily Target 1 | 62.41 | | Daily Target 2 | 62.55 | | Daily Target 3 | 62.673333333333 | | Daily Target 4 | 62.81 | | Daily Target 5 | 62.93 |
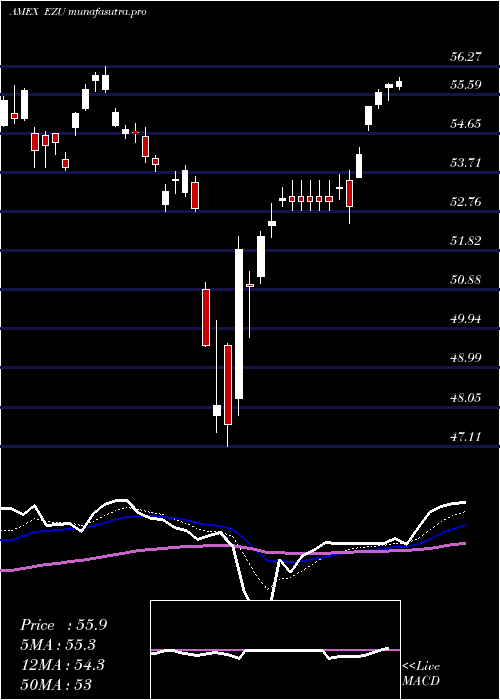
Daily price and volume Emu Index
| Date |
Closing |
Open |
Range |
Volume |
Fri 24 October 2025 |
62.68 (0.02%) |
62.54 |
62.54 - 62.80 |
0.5558 times |
Thu 23 October 2025 |
62.67 (0.69%) |
62.44 |
62.43 - 62.74 |
0.9814 times |
Wed 22 October 2025 |
62.24 (-0.29%) |
62.41 |
61.99 - 62.50 |
0.9143 times |
Tue 21 October 2025 |
62.42 (-0.73%) |
62.77 |
62.42 - 62.84 |
1.2881 times |
Mon 20 October 2025 |
62.88 (0.51%) |
62.70 |
62.65 - 62.96 |
0.6159 times |
Fri 17 October 2025 |
62.56 (-0.03%) |
61.95 |
61.92 - 62.57 |
1.6163 times |
Thu 16 October 2025 |
62.58 (0.95%) |
62.30 |
62.28 - 62.81 |
0.7979 times |
Wed 15 October 2025 |
61.99 (0.26%) |
62.07 |
61.55 - 62.19 |
1.1609 times |
Tue 14 October 2025 |
61.83 (0.57%) |
61.04 |
61.03 - 62.03 |
1.287 times |
Mon 13 October 2025 |
61.48 (0.75%) |
61.22 |
61.15 - 61.51 |
0.7825 times |
Fri 10 October 2025 |
61.02 (-1.45%) |
61.86 |
60.95 - 62.04 |
2.2395 times |
Weekly price and charts EmuIndex Strong weekly Stock price targets for EmuIndex EZU are 61.85 and 62.82 | Weekly Target 1 | 61.57 | | Weekly Target 2 | 62.13 | | Weekly Target 3 | 62.543333333333 | | Weekly Target 4 | 63.1 | | Weekly Target 5 | 63.51 |
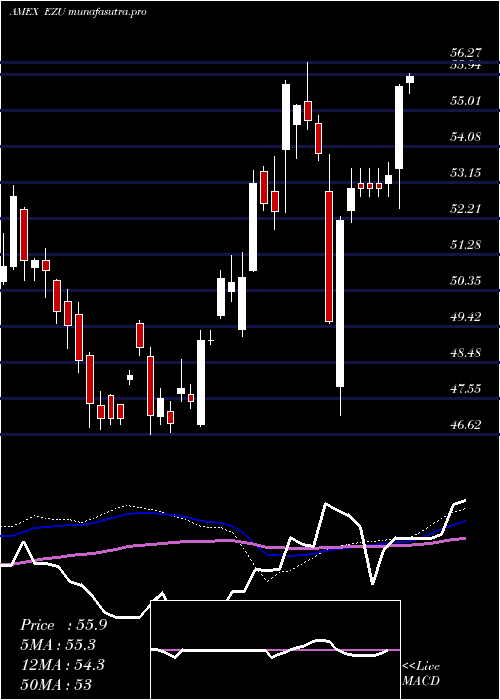
Weekly price and volumes for Emu Index
| Date |
Closing |
Open |
Range |
Volume |
Fri 24 October 2025 |
62.68 (0.19%) |
62.70 |
61.99 - 62.96 |
0.7047 times |
Fri 17 October 2025 |
62.56 (2.52%) |
61.22 |
61.03 - 62.81 |
0.9132 times |
Fri 10 October 2025 |
61.02 (-3.31%) |
62.91 |
60.95 - 62.91 |
1.1411 times |
Fri 03 October 2025 |
63.11 (2.99%) |
61.49 |
61.41 - 63.20 |
1.8695 times |
Fri 26 September 2025 |
61.28 (0.38%) |
60.97 |
60.25 - 61.61 |
1.695 times |
Fri 19 September 2025 |
61.05 (0.76%) |
61.02 |
60.46 - 61.28 |
0.969 times |
Fri 12 September 2025 |
60.59 (1.58%) |
60.02 |
59.88 - 60.66 |
0.9708 times |
Fri 05 September 2025 |
59.65 (-0.27%) |
58.83 |
58.69 - 60.01 |
0.7132 times |
Fri 29 August 2025 |
59.81 (0%) |
59.94 |
59.77 - 60.00 |
0.1644 times |
Fri 29 August 2025 |
59.81 (-2.75%) |
61.30 |
59.51 - 61.34 |
0.8592 times |
Fri 22 August 2025 |
61.50 (0.75%) |
60.62 |
60.46 - 61.61 |
0.795 times |
Monthly price and charts EmuIndex Strong monthly Stock price targets for EmuIndex EZU are 61.82 and 64.07 | Monthly Target 1 | 60.03 | | Monthly Target 2 | 61.35 | | Monthly Target 3 | 62.276666666667 | | Monthly Target 4 | 63.6 | | Monthly Target 5 | 64.53 |
Monthly price and volumes Emu Index
| Date |
Closing |
Open |
Range |
Volume |
Fri 24 October 2025 |
62.68 (1.19%) |
62.25 |
60.95 - 63.20 |
0.6239 times |
Tue 30 September 2025 |
61.94 (3.56%) |
58.83 |
58.69 - 62.05 |
0.8889 times |
Fri 29 August 2025 |
59.81 (3%) |
57.51 |
57.10 - 61.61 |
0.7198 times |
Thu 31 July 2025 |
58.07 (-2.32%) |
59.21 |
57.92 - 60.85 |
1.2205 times |
Mon 30 June 2025 |
59.45 (0.78%) |
58.95 |
56.70 - 60.22 |
0.9539 times |
Fri 30 May 2025 |
58.99 (5.87%) |
56.01 |
55.69 - 59.59 |
0.92 times |
Wed 30 April 2025 |
55.72 (4.64%) |
53.52 |
47.11 - 55.99 |
2.0466 times |
Mon 31 March 2025 |
53.25 (1.64%) |
54.00 |
52.37 - 56.27 |
1.067 times |
Fri 28 February 2025 |
52.39 (3.6%) |
49.35 |
49.17 - 53.82 |
0.9279 times |
Fri 31 January 2025 |
50.57 (7.14%) |
47.11 |
46.67 - 51.26 |
0.6315 times |
Tue 31 December 2024 |
47.20 (0.34%) |
48.04 |
46.62 - 49.58 |
0.4496 times |

DMA SMA EMA moving averages of Emu Index EZU
DMA (daily moving average) of Emu Index EZU
| DMA period | DMA value | | 5 day DMA | 62.58 | | 12 day DMA | 62.19 | | 20 day DMA | 62.29 | | 35 day DMA | 61.65 | | 50 day DMA | 61.21 | | 100 day DMA | 60.25 | | 150 day DMA | 58.57 | | 200 day DMA | 56.95 | EMA (exponential moving average) of Emu Index EZU
| EMA period | EMA current | EMA prev | EMA prev2 | | 5 day EMA | 62.55 | 62.48 | 62.38 | | 12 day EMA | 62.35 | 62.29 | 62.22 | | 20 day EMA | 62.13 | 62.07 | 62.01 | | 35 day EMA | 61.74 | 61.68 | 61.62 | | 50 day EMA | 61.26 | 61.2 | 61.14 |
SMA (simple moving average) of Emu Index EZU
| SMA period | SMA current | SMA prev | SMA prev2 | | 5 day SMA | 62.58 | 62.55 | 62.54 | | 12 day SMA | 62.19 | 62.18 | 62.13 | | 20 day SMA | 62.29 | 62.22 | 62.12 | | 35 day SMA | 61.65 | 61.57 | 61.48 | | 50 day SMA | 61.21 | 61.17 | 61.13 | | 100 day SMA | 60.25 | 60.22 | 60.18 | | 150 day SMA | 58.57 | 58.52 | 58.47 | | 200 day SMA | 56.95 | 56.87 | 56.8 |
|
|
