BrazilIndex EWZ full analysis,charts,indicators,moving averages,SMA,DMA,EMA,ADX,MACD,RSIBrazil Index EWZ WideScreen charts, DMA,SMA,EMA technical analysis, forecast prediction, by indicators ADX,MACD,RSI,CCI AMEX stock exchange
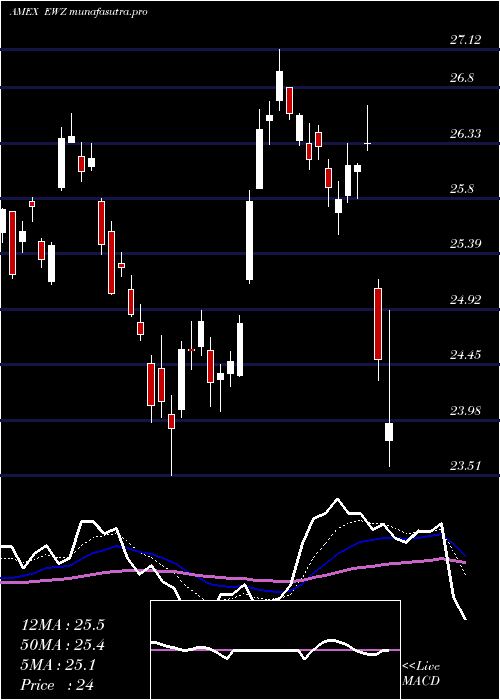
Daily price and charts and targets BrazilIndex Strong Daily Stock price targets for BrazilIndex EWZ are 30.27 and 30.78 | Daily Target 1 | 29.86 | | Daily Target 2 | 30.16 | | Daily Target 3 | 30.366666666667 | | Daily Target 4 | 30.67 | | Daily Target 5 | 30.88 |
Daily price and volume Brazil Index
| Date |
Closing |
Open |
Range |
Volume |
Thu 23 October 2025 |
30.47 (1.4%) |
30.10 |
30.06 - 30.57 |
0.7775 times |
Wed 22 October 2025 |
30.05 (0.37%) |
30.08 |
29.86 - 30.16 |
0.9796 times |
Tue 21 October 2025 |
29.94 (-0.89%) |
30.02 |
29.89 - 30.20 |
1.0671 times |
Mon 20 October 2025 |
30.21 (1.68%) |
29.64 |
29.64 - 30.39 |
0.6665 times |
Fri 17 October 2025 |
29.71 (1.61%) |
29.12 |
29.07 - 29.77 |
0.7666 times |
Thu 16 October 2025 |
29.24 (-0.27%) |
29.27 |
29.18 - 29.64 |
1.1189 times |
Wed 15 October 2025 |
29.32 (0.76%) |
29.20 |
29.19 - 29.55 |
1.0643 times |
Tue 14 October 2025 |
29.10 (-0.27%) |
28.87 |
28.83 - 29.34 |
1.2072 times |
Mon 13 October 2025 |
29.18 (-1.68%) |
29.16 |
29.02 - 29.35 |
1.1097 times |
Tue 07 October 2025 |
29.68 (-2.08%) |
30.03 |
29.64 - 30.08 |
1.2425 times |
Mon 06 October 2025 |
30.31 (-0.07%) |
30.50 |
30.20 - 30.53 |
0.946 times |
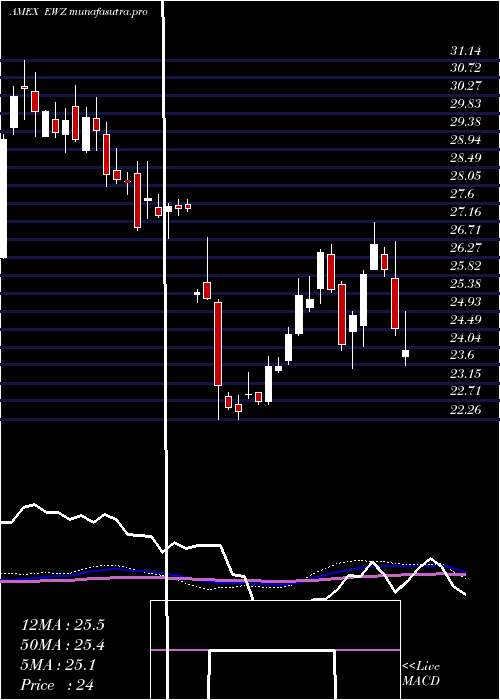
Weekly price and charts BrazilIndex Strong weekly Stock price targets for BrazilIndex EWZ are 30.06 and 30.99 | Weekly Target 1 | 29.3 | | Weekly Target 2 | 29.88 | | Weekly Target 3 | 30.226666666667 | | Weekly Target 4 | 30.81 | | Weekly Target 5 | 31.16 |
Weekly price and volumes for Brazil Index
| Date |
Closing |
Open |
Range |
Volume |
Thu 23 October 2025 |
30.47 (2.56%) |
29.64 |
29.64 - 30.57 |
0.8204 times |
Fri 17 October 2025 |
29.71 (0.1%) |
29.16 |
28.83 - 29.77 |
1.2378 times |
Tue 07 October 2025 |
29.68 (-2.14%) |
30.50 |
29.64 - 30.53 |
0.5144 times |
Fri 03 October 2025 |
30.33 (-1.3%) |
31.13 |
30.00 - 31.26 |
1.4098 times |
Fri 26 September 2025 |
30.73 (-0.65%) |
30.63 |
30.39 - 31.46 |
1.2721 times |
Fri 19 September 2025 |
30.93 (3%) |
30.25 |
30.21 - 31.25 |
1.3112 times |
Fri 12 September 2025 |
30.03 (1.35%) |
29.60 |
29.27 - 30.28 |
0.9903 times |
Fri 05 September 2025 |
29.63 (0.44%) |
28.83 |
28.76 - 29.96 |
0.9258 times |
Fri 29 August 2025 |
29.50 (0%) |
29.44 |
29.40 - 29.57 |
0.1903 times |
Fri 29 August 2025 |
29.50 (3.11%) |
28.66 |
28.36 - 29.76 |
1.3278 times |
Fri 22 August 2025 |
28.61 (1.45%) |
28.28 |
27.33 - 28.67 |
1.5007 times |
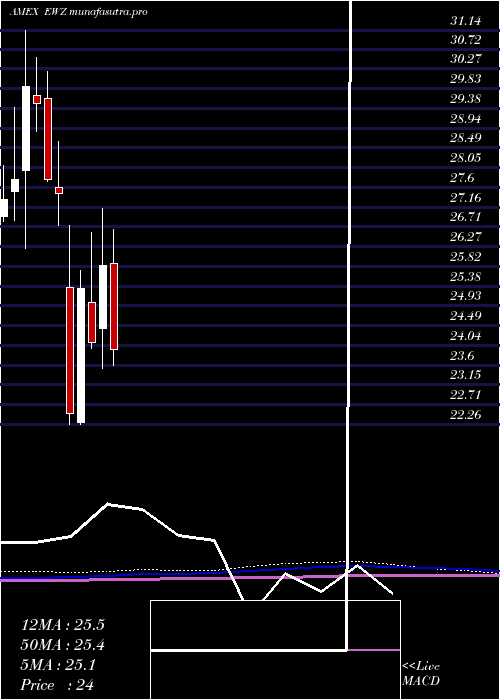
Monthly price and charts BrazilIndex Strong monthly Stock price targets for BrazilIndex EWZ are 28.49 and 30.82 | Monthly Target 1 | 27.82 | | Monthly Target 2 | 29.15 | | Monthly Target 3 | 30.153333333333 | | Monthly Target 4 | 31.48 | | Monthly Target 5 | 32.48 |
Monthly price and volumes Brazil Index
| Date |
Closing |
Open |
Range |
Volume |
Thu 23 October 2025 |
30.47 (-1.71%) |
31.11 |
28.83 - 31.16 |
0.7366 times |
Tue 30 September 2025 |
31.00 (5.08%) |
28.83 |
28.76 - 31.46 |
1.0321 times |
Fri 29 August 2025 |
29.50 (11.11%) |
27.09 |
26.57 - 29.76 |
1.1816 times |
Thu 31 July 2025 |
26.55 (-7.97%) |
28.82 |
26.30 - 29.35 |
1.2252 times |
Mon 30 June 2025 |
28.85 (6.03%) |
27.48 |
27.05 - 28.88 |
0.9509 times |
Fri 30 May 2025 |
27.21 (0.63%) |
27.07 |
26.28 - 28.45 |
1.0016 times |
Wed 30 April 2025 |
27.04 (4.6%) |
25.89 |
23.05 - 27.52 |
1.1033 times |
Mon 31 March 2025 |
25.85 (7.22%) |
24.42 |
23.51 - 27.12 |
0.8777 times |
Fri 28 February 2025 |
24.11 (-4.82%) |
25.01 |
23.96 - 26.58 |
0.9461 times |
Fri 31 January 2025 |
25.33 (12.53%) |
22.30 |
22.26 - 25.73 |
0.9449 times |
Tue 31 December 2024 |
22.51 (-18.03%) |
25.35 |
22.26 - 26.75 |
1.01 times |
DMA SMA EMA moving averages of Brazil Index EWZ
DMA (daily moving average) of Brazil Index EWZ
| DMA period | DMA value | | 5 day DMA | 30.08 | | 12 day DMA | 29.8 | | 20 day DMA | 30.2 | | 35 day DMA | 30.13 | | 50 day DMA | 29.63 | | 100 day DMA | 28.65 | | 150 day DMA | 27.88 | | 200 day DMA | 27.07 | EMA (exponential moving average) of Brazil Index EWZ
| EMA period | EMA current | EMA prev | EMA prev2 | | 5 day EMA | 30.08 | 29.89 | 29.81 | | 12 day EMA | 29.99 | 29.9 | 29.87 | | 20 day EMA | 30.01 | 29.96 | 29.95 | | 35 day EMA | 29.75 | 29.71 | 29.69 | | 50 day EMA | 29.5 | 29.46 | 29.44 |
SMA (simple moving average) of Brazil Index EWZ
| SMA period | SMA current | SMA prev | SMA prev2 | | 5 day SMA | 30.08 | 29.83 | 29.68 | | 12 day SMA | 29.8 | 29.78 | 29.82 | | 20 day SMA | 30.2 | 30.22 | 30.26 | | 35 day SMA | 30.13 | 30.1 | 30.08 | | 50 day SMA | 29.63 | 29.58 | 29.53 | | 100 day SMA | 28.65 | 28.63 | 28.61 | | 150 day SMA | 27.88 | 27.85 | 27.82 | | 200 day SMA | 27.07 | 27.03 | 26.99 |
|
|
