MexicoInvestable EWW full analysis,charts,indicators,moving averages,SMA,DMA,EMA,ADX,MACD,RSIMexico Investable EWW WideScreen charts, DMA,SMA,EMA technical analysis, forecast prediction, by indicators ADX,MACD,RSI,CCI AMEX stock exchange
Daily price and charts and targets MexicoInvestable Strong Daily Stock price targets for MexicoInvestable EWW are 64.64 and 65.92 | Daily Target 1 | 64.38 | | Daily Target 2 | 64.9 | | Daily Target 3 | 65.663333333333 | | Daily Target 4 | 66.18 | | Daily Target 5 | 66.94 |
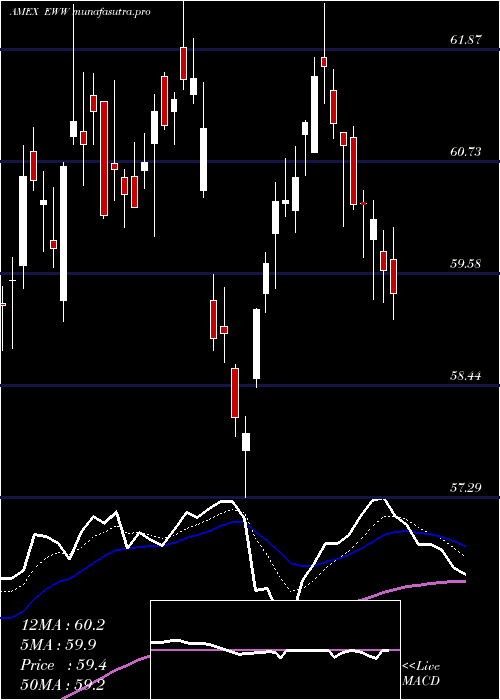
Daily price and volume Mexico Investable
| Date |
Closing |
Open |
Range |
Volume |
Fri 24 October 2025 |
65.41 (-0.88%) |
65.60 |
65.15 - 66.43 |
0.5212 times |
Thu 23 October 2025 |
65.99 (0.69%) |
65.45 |
65.33 - 66.15 |
0.3666 times |
Wed 22 October 2025 |
65.54 (0.72%) |
64.98 |
64.97 - 65.79 |
0.7979 times |
Tue 21 October 2025 |
65.07 (-1.32%) |
65.84 |
64.81 - 65.93 |
1.5611 times |
Mon 20 October 2025 |
65.94 (-0.29%) |
66.54 |
65.58 - 66.66 |
0.7468 times |
Fri 17 October 2025 |
66.13 (-1.37%) |
67.05 |
65.81 - 67.05 |
1.1921 times |
Thu 16 October 2025 |
67.05 (1.79%) |
66.14 |
66.10 - 67.49 |
1.2231 times |
Wed 15 October 2025 |
65.87 (1.59%) |
65.20 |
65.20 - 65.93 |
1.1571 times |
Tue 14 October 2025 |
64.84 (-0.96%) |
64.83 |
64.70 - 65.14 |
1.2613 times |
Mon 13 October 2025 |
65.47 (0.66%) |
64.90 |
64.78 - 66.03 |
1.1728 times |
Tue 07 October 2025 |
65.04 (-0.61%) |
65.50 |
64.96 - 65.88 |
0.709 times |
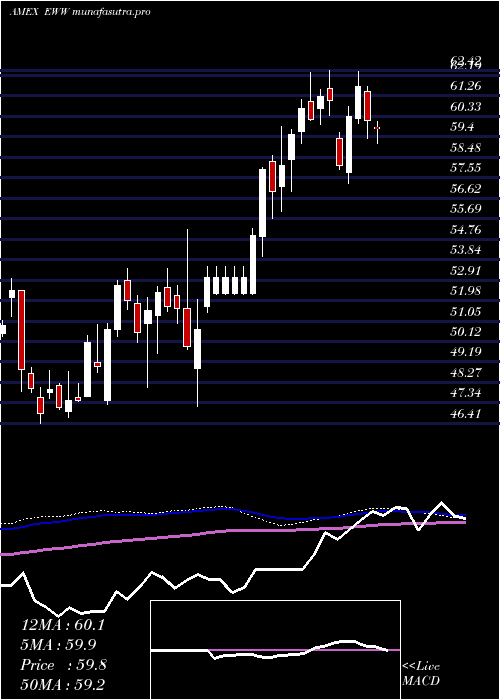
Weekly price and charts MexicoInvestable Strong weekly Stock price targets for MexicoInvestable EWW are 64.19 and 66.04 | Weekly Target 1 | 63.78 | | Weekly Target 2 | 64.59 | | Weekly Target 3 | 65.626666666667 | | Weekly Target 4 | 66.44 | | Weekly Target 5 | 67.48 |
Weekly price and volumes for Mexico Investable
| Date |
Closing |
Open |
Range |
Volume |
Fri 24 October 2025 |
65.41 (-1.09%) |
66.54 |
64.81 - 66.66 |
1.0132 times |
Fri 17 October 2025 |
66.13 (1.68%) |
64.90 |
64.70 - 67.49 |
1.5239 times |
Tue 07 October 2025 |
65.04 (-2.65%) |
66.81 |
64.93 - 66.81 |
0.4659 times |
Fri 03 October 2025 |
66.81 (-0.49%) |
67.27 |
65.52 - 68.71 |
1.1946 times |
Fri 26 September 2025 |
67.14 (1.57%) |
65.86 |
65.58 - 67.50 |
1.0946 times |
Fri 19 September 2025 |
66.10 (-0.03%) |
66.31 |
65.51 - 67.30 |
1.4766 times |
Fri 12 September 2025 |
66.12 (3.59%) |
64.11 |
63.58 - 66.29 |
1.2096 times |
Fri 05 September 2025 |
63.83 (3.05%) |
61.20 |
61.20 - 64.30 |
0.8471 times |
Fri 29 August 2025 |
61.94 (0%) |
62.51 |
61.88 - 62.51 |
0.1696 times |
Fri 29 August 2025 |
61.94 (-1.37%) |
62.70 |
60.44 - 62.90 |
1.005 times |
Fri 22 August 2025 |
62.80 (2.38%) |
60.99 |
60.69 - 63.02 |
0.7797 times |
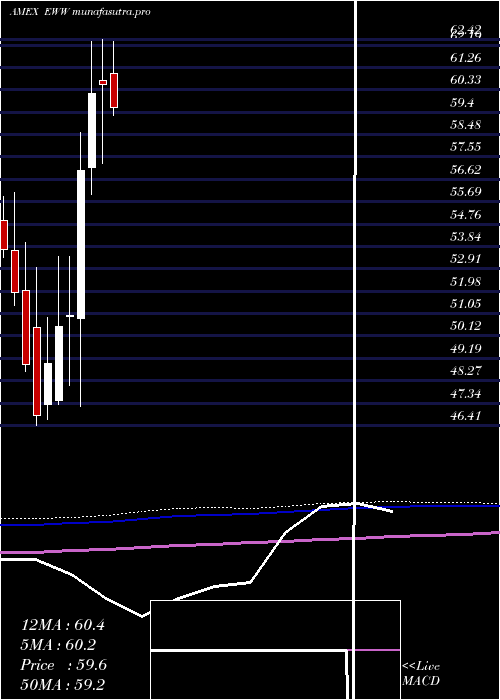
Monthly price and charts MexicoInvestable Strong monthly Stock price targets for MexicoInvestable EWW are 63.05 and 67.06 | Monthly Target 1 | 62.26 | | Monthly Target 2 | 63.84 | | Monthly Target 3 | 66.273333333333 | | Monthly Target 4 | 67.85 | | Monthly Target 5 | 70.28 |
Monthly price and volumes Mexico Investable
| Date |
Closing |
Open |
Range |
Volume |
Fri 24 October 2025 |
65.41 (-4.1%) |
68.25 |
64.70 - 68.71 |
0.5759 times |
Tue 30 September 2025 |
68.21 (10.12%) |
61.20 |
61.20 - 68.35 |
0.7945 times |
Fri 29 August 2025 |
61.94 (2.99%) |
59.90 |
59.23 - 63.02 |
0.5824 times |
Thu 31 July 2025 |
60.14 (-0.69%) |
61.00 |
58.87 - 62.34 |
0.6665 times |
Mon 30 June 2025 |
60.56 (0.65%) |
60.70 |
57.29 - 62.42 |
0.7579 times |
Fri 30 May 2025 |
60.17 (5.62%) |
57.12 |
56.01 - 62.33 |
0.9706 times |
Wed 30 April 2025 |
56.97 (11.79%) |
50.85 |
47.19 - 58.56 |
1.7324 times |
Mon 31 March 2025 |
50.96 (0.87%) |
50.93 |
48.05 - 53.43 |
1.2393 times |
Fri 28 February 2025 |
50.52 (3.14%) |
47.46 |
47.29 - 53.44 |
1.3305 times |
Fri 31 January 2025 |
48.98 (4.61%) |
47.28 |
46.68 - 50.87 |
1.3499 times |
Tue 31 December 2024 |
46.82 (-4.35%) |
50.49 |
46.41 - 52.97 |
0.6712 times |
DMA SMA EMA moving averages of Mexico Investable EWW
DMA (daily moving average) of Mexico Investable EWW
| DMA period | DMA value | | 5 day DMA | 65.59 | | 12 day DMA | 65.65 | | 20 day DMA | 66.19 | | 35 day DMA | 65.84 | | 50 day DMA | 64.62 | | 100 day DMA | 62.51 | | 150 day DMA | 60.11 | | 200 day DMA | 57.67 | EMA (exponential moving average) of Mexico Investable EWW
| EMA period | EMA current | EMA prev | EMA prev2 | | 5 day EMA | 65.65 | 65.77 | 65.66 | | 12 day EMA | 65.82 | 65.89 | 65.87 | | 20 day EMA | 65.81 | 65.85 | 65.84 | | 35 day EMA | 65.16 | 65.14 | 65.09 | | 50 day EMA | 64.47 | 64.43 | 64.37 |
SMA (simple moving average) of Mexico Investable EWW
| SMA period | SMA current | SMA prev | SMA prev2 | | 5 day SMA | 65.59 | 65.73 | 65.95 | | 12 day SMA | 65.65 | 65.77 | 65.84 | | 20 day SMA | 66.19 | 66.29 | 66.33 | | 35 day SMA | 65.84 | 65.77 | 65.65 | | 50 day SMA | 64.62 | 64.56 | 64.47 | | 100 day SMA | 62.51 | 62.47 | 62.42 | | 150 day SMA | 60.11 | 60.02 | 59.93 | | 200 day SMA | 57.67 | 57.58 | 57.49 |
|
|
