TaiwanIndex EWT full analysis,charts,indicators,moving averages,SMA,DMA,EMA,ADX,MACD,RSITaiwan Index EWT WideScreen charts, DMA,SMA,EMA technical analysis, forecast prediction, by indicators ADX,MACD,RSI,CCI AMEX stock exchange
Daily price and charts and targets TaiwanIndex Strong Daily Stock price targets for TaiwanIndex EWT are 66.38 and 66.75 | Daily Target 1 | 66.09 | | Daily Target 2 | 66.29 | | Daily Target 3 | 66.463333333333 | | Daily Target 4 | 66.66 | | Daily Target 5 | 66.83 |
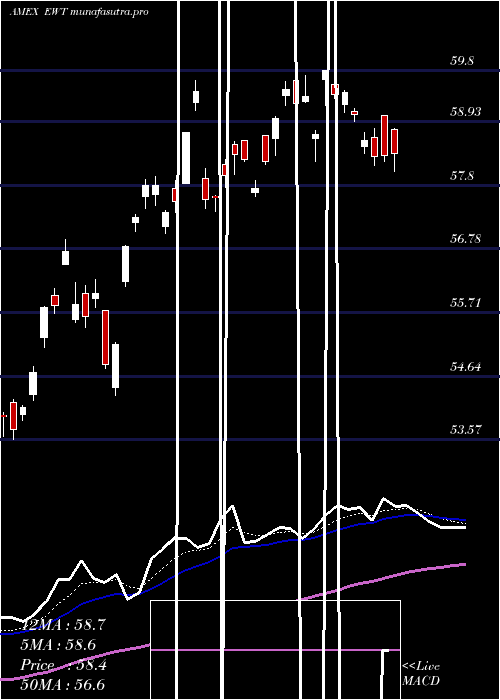
Daily price and volume Taiwan Index
| Date |
Closing |
Open |
Range |
Volume |
Fri 24 October 2025 |
66.48 (1.14%) |
66.42 |
66.27 - 66.64 |
0.6507 times |
Thu 23 October 2025 |
65.73 (1.03%) |
65.25 |
65.23 - 65.85 |
0.5168 times |
Wed 22 October 2025 |
65.06 (-1.09%) |
65.90 |
64.76 - 65.90 |
0.9044 times |
Tue 21 October 2025 |
65.78 (-0.59%) |
66.18 |
65.77 - 66.19 |
0.8813 times |
Mon 20 October 2025 |
66.17 (1.66%) |
65.70 |
65.70 - 66.44 |
0.5447 times |
Fri 17 October 2025 |
65.09 (-0.12%) |
64.59 |
64.55 - 65.24 |
0.9368 times |
Thu 16 October 2025 |
65.17 (0.28%) |
65.10 |
64.85 - 65.78 |
0.8841 times |
Wed 15 October 2025 |
64.99 (2.03%) |
65.04 |
64.41 - 65.29 |
1.4371 times |
Tue 14 October 2025 |
63.70 (-1.33%) |
63.16 |
62.83 - 64.11 |
1.7385 times |
Mon 13 October 2025 |
64.56 (4.77%) |
64.27 |
63.88 - 64.70 |
1.5056 times |
Fri 10 October 2025 |
61.62 (-4.95%) |
64.93 |
61.60 - 64.95 |
1.8953 times |
Weekly price and charts TaiwanIndex Strong weekly Stock price targets for TaiwanIndex EWT are 65.62 and 67.5 | Weekly Target 1 | 64.08 | | Weekly Target 2 | 65.28 | | Weekly Target 3 | 65.96 | | Weekly Target 4 | 67.16 | | Weekly Target 5 | 67.84 |
Weekly price and volumes for Taiwan Index
| Date |
Closing |
Open |
Range |
Volume |
Fri 24 October 2025 |
66.48 (2.14%) |
65.70 |
64.76 - 66.64 |
0.8851 times |
Fri 17 October 2025 |
65.09 (5.63%) |
64.27 |
62.83 - 65.78 |
1.6453 times |
Fri 10 October 2025 |
61.62 (-4.67%) |
64.81 |
61.60 - 65.69 |
1.3133 times |
Fri 03 October 2025 |
64.64 (3.03%) |
63.20 |
62.99 - 64.87 |
1.0226 times |
Fri 26 September 2025 |
62.74 (-1.01%) |
63.56 |
62.24 - 64.67 |
1.0363 times |
Fri 19 September 2025 |
63.38 (0.88%) |
62.86 |
62.74 - 63.89 |
1.1829 times |
Fri 12 September 2025 |
62.83 (4.35%) |
60.66 |
60.60 - 62.95 |
1.0664 times |
Fri 05 September 2025 |
60.21 (2.36%) |
57.63 |
57.56 - 60.43 |
0.5852 times |
Fri 29 August 2025 |
58.82 (0%) |
59.18 |
58.62 - 59.18 |
0.295 times |
Fri 29 August 2025 |
58.82 (-1.41%) |
59.45 |
58.62 - 59.95 |
0.9678 times |
Fri 22 August 2025 |
59.66 (-1.26%) |
61.02 |
58.25 - 61.15 |
0.8211 times |

Monthly price and charts TaiwanIndex Strong monthly Stock price targets for TaiwanIndex EWT are 64.04 and 69.08 | Monthly Target 1 | 59.87 | | Monthly Target 2 | 63.17 | | Monthly Target 3 | 64.906666666667 | | Monthly Target 4 | 68.21 | | Monthly Target 5 | 69.95 |
Monthly price and volumes Taiwan Index
| Date |
Closing |
Open |
Range |
Volume |
Fri 24 October 2025 |
66.48 (4.5%) |
63.59 |
61.60 - 66.64 |
0.9242 times |
Tue 30 September 2025 |
63.62 (8.16%) |
57.63 |
57.56 - 64.67 |
0.9016 times |
Fri 29 August 2025 |
58.82 (0.79%) |
58.81 |
58.09 - 61.36 |
0.8425 times |
Thu 31 July 2025 |
58.36 (1.67%) |
57.81 |
57.40 - 59.80 |
1.0705 times |
Mon 30 June 2025 |
57.40 (9.58%) |
52.25 |
52.22 - 58.00 |
1.1652 times |
Fri 30 May 2025 |
52.38 (10.32%) |
48.27 |
47.81 - 54.42 |
1.1559 times |
Wed 30 April 2025 |
47.48 (0%) |
47.58 |
39.44 - 48.73 |
1.1539 times |
Mon 31 March 2025 |
47.48 (-6.55%) |
51.32 |
46.67 - 52.20 |
0.8993 times |
Fri 28 February 2025 |
50.81 (-1.24%) |
50.68 |
50.21 - 53.67 |
0.7267 times |
Fri 31 January 2025 |
51.45 (-0.6%) |
51.49 |
49.80 - 54.19 |
1.1603 times |
Tue 31 December 2024 |
51.76 (-3.29%) |
53.93 |
51.31 - 55.56 |
0.5029 times |

DMA SMA EMA moving averages of Taiwan Index EWT
DMA (daily moving average) of Taiwan Index EWT
| DMA period | DMA value | | 5 day DMA | 65.84 | | 12 day DMA | 64.93 | | 20 day DMA | 64.71 | | 35 day DMA | 63.98 | | 50 day DMA | 62.6 | | 100 day DMA | 60.24 | | 150 day DMA | 56.39 | | 200 day DMA | 55.2 | EMA (exponential moving average) of Taiwan Index EWT
| EMA period | EMA current | EMA prev | EMA prev2 | | 5 day EMA | 65.79 | 65.44 | 65.29 | | 12 day EMA | 65.23 | 65 | 64.87 | | 20 day EMA | 64.73 | 64.55 | 64.43 | | 35 day EMA | 63.71 | 63.55 | 63.42 | | 50 day EMA | 62.77 | 62.62 | 62.49 |
SMA (simple moving average) of Taiwan Index EWT
| SMA period | SMA current | SMA prev | SMA prev2 | | 5 day SMA | 65.84 | 65.57 | 65.45 | | 12 day SMA | 64.93 | 64.86 | 64.79 | | 20 day SMA | 64.71 | 64.52 | 64.39 | | 35 day SMA | 63.98 | 63.8 | 63.62 | | 50 day SMA | 62.6 | 62.47 | 62.37 | | 100 day SMA | 60.24 | 60.1 | 59.97 | | 150 day SMA | 56.39 | 56.29 | 56.18 | | 200 day SMA | 55.2 | 55.12 | 55.05 |
|
|
