SingaporeIndex EWS full analysis,charts,indicators,moving averages,SMA,DMA,EMA,ADX,MACD,RSISingapore Index EWS WideScreen charts, DMA,SMA,EMA technical analysis, forecast prediction, by indicators ADX,MACD,RSI,CCI AMEX stock exchange
Daily price and charts and targets SingaporeIndex Strong Daily Stock price targets for SingaporeIndex EWS are 28.22 and 28.38 | Daily Target 1 | 28.09 | | Daily Target 2 | 28.18 | | Daily Target 3 | 28.25 | | Daily Target 4 | 28.34 | | Daily Target 5 | 28.41 |
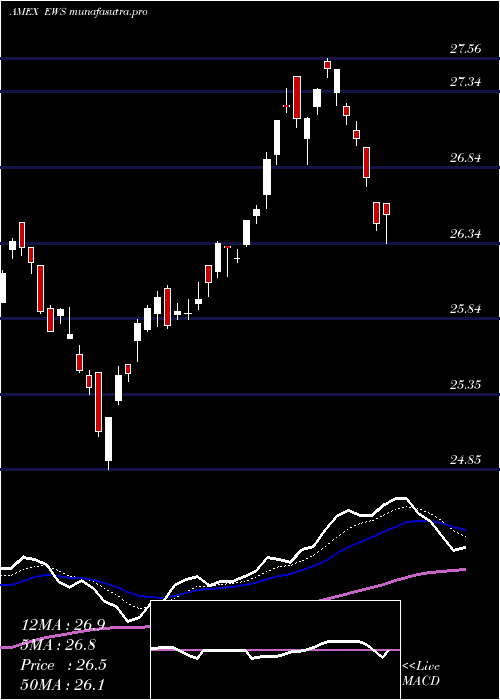
Daily price and volume Singapore Index
| Date |
Closing |
Open |
Range |
Volume |
Thu 23 October 2025 |
28.27 (0.93%) |
28.21 |
28.16 - 28.32 |
0.5114 times |
Wed 22 October 2025 |
28.01 (-0.43%) |
28.05 |
27.89 - 28.16 |
0.6914 times |
Tue 21 October 2025 |
28.13 (-0.85%) |
28.32 |
28.13 - 28.32 |
0.5947 times |
Mon 20 October 2025 |
28.37 (1.07%) |
28.17 |
28.16 - 28.42 |
0.7415 times |
Fri 17 October 2025 |
28.07 (0.32%) |
27.70 |
27.70 - 28.13 |
1.3438 times |
Thu 16 October 2025 |
27.98 (-0.46%) |
28.18 |
27.91 - 28.38 |
1.3847 times |
Wed 15 October 2025 |
28.11 (-1.06%) |
28.67 |
28.10 - 28.71 |
1.4288 times |
Tue 14 October 2025 |
28.41 (-0.59%) |
28.25 |
28.14 - 28.58 |
0.8296 times |
Mon 13 October 2025 |
28.58 (0.88%) |
28.56 |
28.49 - 28.65 |
0.9735 times |
Fri 10 October 2025 |
28.33 (-2.38%) |
29.03 |
28.32 - 29.10 |
1.5006 times |
Thu 09 October 2025 |
29.02 (-1.33%) |
29.35 |
28.88 - 29.35 |
0.637 times |
Weekly price and charts SingaporeIndex Strong weekly Stock price targets for SingaporeIndex EWS are 28.08 and 28.61 | Weekly Target 1 | 27.66 | | Weekly Target 2 | 27.97 | | Weekly Target 3 | 28.193333333333 | | Weekly Target 4 | 28.5 | | Weekly Target 5 | 28.72 |
Weekly price and volumes for Singapore Index
| Date |
Closing |
Open |
Range |
Volume |
Thu 23 October 2025 |
28.27 (0.71%) |
28.17 |
27.89 - 28.42 |
0.8725 times |
Fri 17 October 2025 |
28.07 (-0.92%) |
28.56 |
27.70 - 28.71 |
2.0481 times |
Fri 10 October 2025 |
28.33 (-2.58%) |
29.10 |
28.32 - 29.65 |
1.3981 times |
Fri 03 October 2025 |
29.08 (2.57%) |
28.43 |
28.21 - 29.12 |
1.1865 times |
Fri 26 September 2025 |
28.35 (-1.66%) |
28.80 |
28.14 - 28.95 |
0.8225 times |
Fri 19 September 2025 |
28.83 (-0.62%) |
29.07 |
28.58 - 29.07 |
0.8925 times |
Fri 12 September 2025 |
29.01 (1.68%) |
28.61 |
28.33 - 29.18 |
0.9242 times |
Fri 05 September 2025 |
28.53 (1.53%) |
27.98 |
27.85 - 28.60 |
1.0231 times |
Fri 29 August 2025 |
28.10 (0%) |
28.01 |
27.99 - 28.15 |
0.0992 times |
Fri 29 August 2025 |
28.10 (-0.6%) |
28.07 |
27.80 - 28.21 |
0.7334 times |
Fri 22 August 2025 |
28.27 (1.91%) |
27.54 |
27.44 - 28.32 |
0.6344 times |

Monthly price and charts SingaporeIndex Strong monthly Stock price targets for SingaporeIndex EWS are 27.01 and 28.96 | Monthly Target 1 | 26.59 | | Monthly Target 2 | 27.43 | | Monthly Target 3 | 28.54 | | Monthly Target 4 | 29.38 | | Monthly Target 5 | 30.49 |
Monthly price and volumes Singapore Index
| Date |
Closing |
Open |
Range |
Volume |
Thu 23 October 2025 |
28.27 (-0.25%) |
28.51 |
27.70 - 29.65 |
1.0766 times |
Tue 30 September 2025 |
28.34 (0.85%) |
27.98 |
27.85 - 29.18 |
0.8893 times |
Fri 29 August 2025 |
28.10 (6.16%) |
26.60 |
26.34 - 28.32 |
0.7315 times |
Thu 31 July 2025 |
26.47 (1.89%) |
26.04 |
25.78 - 27.56 |
0.9686 times |
Mon 30 June 2025 |
25.98 (0.93%) |
25.82 |
24.85 - 26.48 |
0.6642 times |
Fri 30 May 2025 |
25.74 (5.8%) |
24.20 |
24.20 - 26.14 |
0.9512 times |
Wed 30 April 2025 |
24.33 (2.4%) |
23.72 |
20.08 - 24.38 |
2.0758 times |
Mon 31 March 2025 |
23.76 (2.19%) |
23.59 |
22.81 - 24.17 |
0.8709 times |
Fri 28 February 2025 |
23.25 (2.97%) |
22.34 |
22.31 - 23.90 |
0.9593 times |
Fri 31 January 2025 |
22.58 (3.34%) |
21.90 |
21.45 - 22.79 |
0.8126 times |
Tue 31 December 2024 |
21.85 (-2.63%) |
22.79 |
21.68 - 23.16 |
0.4959 times |

DMA SMA EMA moving averages of Singapore Index EWS
DMA (daily moving average) of Singapore Index EWS
| DMA period | DMA value | | 5 day DMA | 28.17 | | 12 day DMA | 28.39 | | 20 day DMA | 28.55 | | 35 day DMA | 28.64 | | 50 day DMA | 28.43 | | 100 day DMA | 27.44 | | 150 day DMA | 26.29 | | 200 day DMA | 25.46 | EMA (exponential moving average) of Singapore Index EWS
| EMA period | EMA current | EMA prev | EMA prev2 | | 5 day EMA | 28.2 | 28.16 | 28.23 | | 12 day EMA | 28.34 | 28.35 | 28.41 | | 20 day EMA | 28.42 | 28.44 | 28.48 | | 35 day EMA | 28.4 | 28.41 | 28.43 | | 50 day EMA | 28.33 | 28.33 | 28.34 |
SMA (simple moving average) of Singapore Index EWS
| SMA period | SMA current | SMA prev | SMA prev2 | | 5 day SMA | 28.17 | 28.11 | 28.13 | | 12 day SMA | 28.39 | 28.5 | 28.6 | | 20 day SMA | 28.55 | 28.55 | 28.57 | | 35 day SMA | 28.64 | 28.64 | 28.64 | | 50 day SMA | 28.43 | 28.42 | 28.42 | | 100 day SMA | 27.44 | 27.41 | 27.39 | | 150 day SMA | 26.29 | 26.26 | 26.23 | | 200 day SMA | 25.46 | 25.43 | 25.4 |
|
|
