AustriaInvestable EWO full analysis,charts,indicators,moving averages,SMA,DMA,EMA,ADX,MACD,RSIAustria Investable EWO WideScreen charts, DMA,SMA,EMA technical analysis, forecast prediction, by indicators ADX,MACD,RSI,CCI AMEX stock exchange
Daily price and charts and targets AustriaInvestable Strong Daily Stock price targets for AustriaInvestable EWO are 30.78 and 31.04 | Daily Target 1 | 30.57 | | Daily Target 2 | 30.73 | | Daily Target 3 | 30.833333333333 | | Daily Target 4 | 30.99 | | Daily Target 5 | 31.09 |
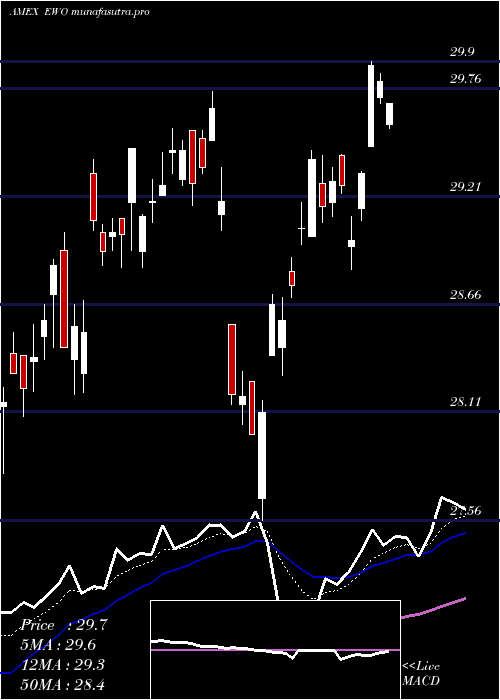
Daily price and volume Austria Investable
| Date |
Closing |
Open |
Range |
Volume |
Thu 23 October 2025 |
30.88 (1.21%) |
30.68 |
30.68 - 30.94 |
0.4649 times |
Wed 22 October 2025 |
30.51 (0.1%) |
30.51 |
30.44 - 30.66 |
1.0525 times |
Tue 21 October 2025 |
30.48 (-0.39%) |
30.53 |
30.44 - 30.57 |
0.8431 times |
Mon 20 October 2025 |
30.60 (0.1%) |
30.56 |
30.56 - 30.70 |
0.5209 times |
Fri 17 October 2025 |
30.57 (-1.26%) |
30.47 |
30.36 - 30.60 |
0.8121 times |
Thu 16 October 2025 |
30.96 (0.19%) |
30.85 |
30.84 - 31.09 |
1.378 times |
Wed 15 October 2025 |
30.90 (-0.83%) |
31.22 |
30.81 - 31.22 |
1.2275 times |
Tue 14 October 2025 |
31.16 (0.26%) |
30.79 |
30.79 - 31.22 |
0.4154 times |
Mon 13 October 2025 |
31.08 (1.2%) |
30.87 |
30.87 - 31.12 |
2.4549 times |
Fri 10 October 2025 |
30.71 (-1.13%) |
30.99 |
30.70 - 31.00 |
0.8307 times |
Thu 09 October 2025 |
31.06 (-0.06%) |
31.36 |
30.99 - 31.36 |
2.4054 times |
Weekly price and charts AustriaInvestable Strong weekly Stock price targets for AustriaInvestable EWO are 30.66 and 31.16 | Weekly Target 1 | 30.25 | | Weekly Target 2 | 30.57 | | Weekly Target 3 | 30.753333333333 | | Weekly Target 4 | 31.07 | | Weekly Target 5 | 31.25 |
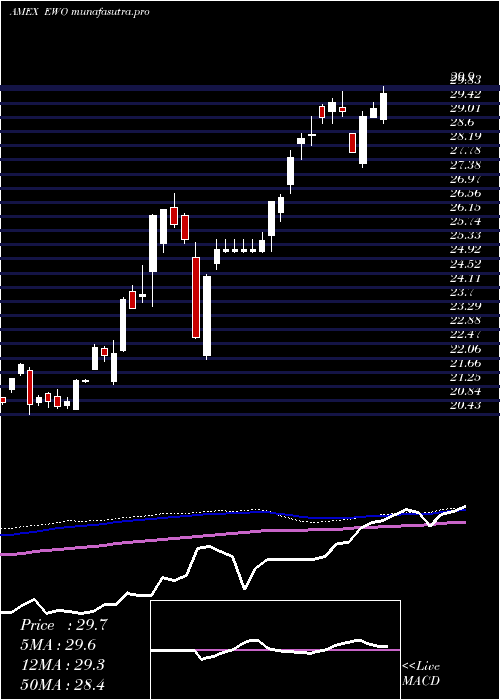
Weekly price and volumes for Austria Investable
| Date |
Closing |
Open |
Range |
Volume |
Thu 23 October 2025 |
30.88 (1.01%) |
30.56 |
30.44 - 30.94 |
0.4053 times |
Fri 17 October 2025 |
30.57 (-0.46%) |
30.87 |
30.36 - 31.22 |
0.8843 times |
Fri 10 October 2025 |
30.71 (-3.18%) |
31.49 |
30.70 - 31.63 |
0.7992 times |
Fri 03 October 2025 |
31.72 (2.32%) |
31.00 |
30.79 - 31.73 |
1.202 times |
Fri 26 September 2025 |
31.00 (0%) |
30.98 |
30.63 - 31.16 |
0.9608 times |
Fri 19 September 2025 |
31.00 (0.39%) |
30.97 |
30.60 - 31.03 |
0.8239 times |
Fri 12 September 2025 |
30.88 (1.11%) |
30.95 |
30.55 - 31.02 |
1.1989 times |
Fri 05 September 2025 |
30.54 (-0.88%) |
30.30 |
30.22 - 30.82 |
1.2363 times |
Fri 29 August 2025 |
30.81 (0%) |
30.75 |
30.74 - 30.86 |
0.2903 times |
Fri 29 August 2025 |
30.81 (-3.51%) |
32.00 |
30.64 - 32.00 |
2.1989 times |
Fri 22 August 2025 |
31.93 (-1.36%) |
32.00 |
31.55 - 32.32 |
1.1587 times |
Monthly price and charts AustriaInvestable Strong monthly Stock price targets for AustriaInvestable EWO are 29.94 and 31.31 | Monthly Target 1 | 29.62 | | Monthly Target 2 | 30.25 | | Monthly Target 3 | 30.99 | | Monthly Target 4 | 31.62 | | Monthly Target 5 | 32.36 |
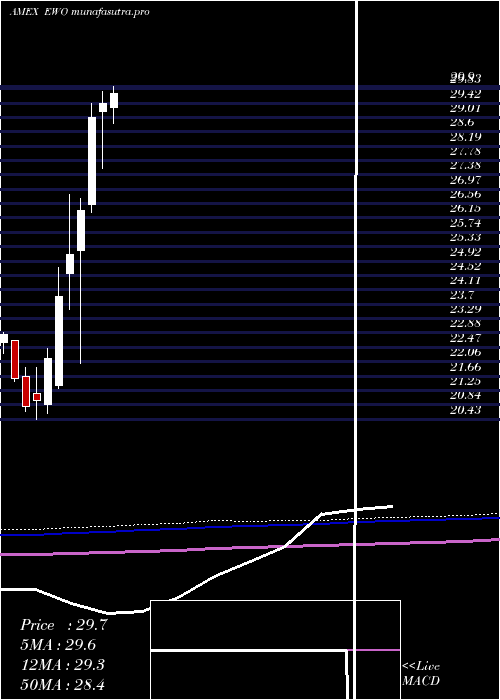
Monthly price and volumes Austria Investable
| Date |
Closing |
Open |
Range |
Volume |
Thu 23 October 2025 |
30.88 (-0.35%) |
31.26 |
30.36 - 31.73 |
0.2443 times |
Tue 30 September 2025 |
30.99 (0.58%) |
30.30 |
30.22 - 31.16 |
0.4086 times |
Fri 29 August 2025 |
30.81 (4.8%) |
29.47 |
29.08 - 32.40 |
0.6259 times |
Thu 31 July 2025 |
29.40 (0%) |
29.28 |
28.84 - 30.59 |
0.8672 times |
Mon 30 June 2025 |
29.40 (1.31%) |
29.18 |
27.56 - 29.75 |
1.3574 times |
Fri 30 May 2025 |
29.02 (10.05%) |
26.54 |
26.32 - 29.40 |
1.2042 times |
Wed 30 April 2025 |
26.37 (4.98%) |
25.24 |
22.01 - 26.70 |
2.0405 times |
Mon 31 March 2025 |
25.12 (5.06%) |
24.56 |
23.56 - 26.83 |
2.2167 times |
Fri 28 February 2025 |
23.91 (7.95%) |
21.40 |
21.30 - 24.75 |
0.4795 times |
Fri 31 January 2025 |
22.15 (5.63%) |
20.85 |
20.58 - 22.45 |
0.5557 times |
Tue 31 December 2024 |
20.97 (0.87%) |
21.16 |
20.43 - 21.91 |
0.131 times |
DMA SMA EMA moving averages of Austria Investable EWO
DMA (daily moving average) of Austria Investable EWO
| DMA period | DMA value | | 5 day DMA | 30.61 | | 12 day DMA | 30.83 | | 20 day DMA | 31.01 | | 35 day DMA | 30.95 | | 50 day DMA | 31.06 | | 100 day DMA | 30.34 | | 150 day DMA | 29.02 | | 200 day DMA | 27.63 | EMA (exponential moving average) of Austria Investable EWO
| EMA period | EMA current | EMA prev | EMA prev2 | | 5 day EMA | 30.71 | 30.62 | 30.67 | | 12 day EMA | 30.82 | 30.81 | 30.86 | | 20 day EMA | 30.9 | 30.9 | 30.94 | | 35 day EMA | 31 | 31.01 | 31.04 | | 50 day EMA | 31.06 | 31.07 | 31.09 |
SMA (simple moving average) of Austria Investable EWO
| SMA period | SMA current | SMA prev | SMA prev2 | | 5 day SMA | 30.61 | 30.62 | 30.7 | | 12 day SMA | 30.83 | 30.86 | 30.94 | | 20 day SMA | 31.01 | 31.01 | 31.03 | | 35 day SMA | 30.95 | 30.94 | 30.94 | | 50 day SMA | 31.06 | 31.08 | 31.1 | | 100 day SMA | 30.34 | 30.32 | 30.31 | | 150 day SMA | 29.02 | 28.98 | 28.95 | | 200 day SMA | 27.63 | 27.58 | 27.53 |
|
|
