NetherlandsInvstbl EWN full analysis,charts,indicators,moving averages,SMA,DMA,EMA,ADX,MACD,RSINetherlands Invstbl EWN WideScreen charts, DMA,SMA,EMA technical analysis, forecast prediction, by indicators ADX,MACD,RSI,CCI AMEX stock exchange
Daily price and charts and targets NetherlandsInvstbl Strong Daily Stock price targets for NetherlandsInvstbl EWN are 58.87 and 59.16 | Daily Target 1 | 58.66 | | Daily Target 2 | 58.79 | | Daily Target 3 | 58.953333333333 | | Daily Target 4 | 59.08 | | Daily Target 5 | 59.24 |
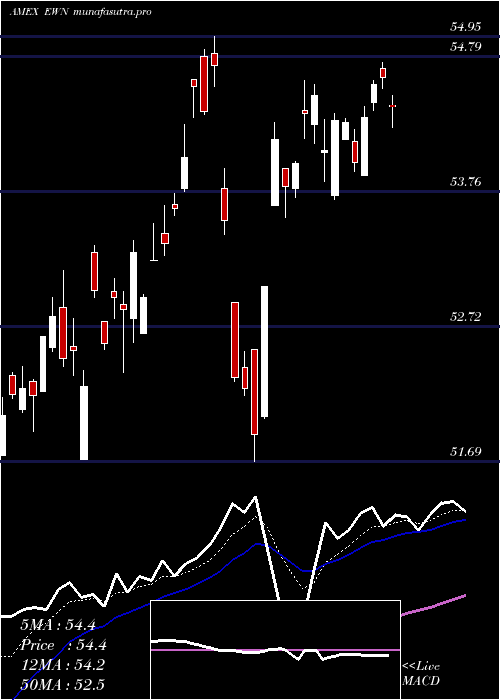
Daily price and volume Netherlands Invstbl
| Date |
Closing |
Open |
Range |
Volume |
Fri 24 October 2025 |
58.91 (0.19%) |
58.85 |
58.83 - 59.12 |
0.8984 times |
Thu 23 October 2025 |
58.80 (1.36%) |
58.11 |
58.11 - 58.86 |
0.121 times |
Wed 22 October 2025 |
58.01 (-0.58%) |
58.20 |
57.93 - 58.63 |
0.4451 times |
Tue 21 October 2025 |
58.35 (-0.83%) |
58.63 |
58.35 - 58.71 |
0.2408 times |
Mon 20 October 2025 |
58.84 (0.32%) |
58.61 |
58.61 - 59.04 |
0.7454 times |
Fri 17 October 2025 |
58.65 (0.27%) |
58.14 |
58.14 - 58.67 |
0.1928 times |
Thu 16 October 2025 |
58.49 (0.38%) |
58.79 |
58.29 - 58.79 |
0.1292 times |
Wed 15 October 2025 |
58.27 (0.88%) |
58.65 |
57.80 - 58.69 |
6.7028 times |
Tue 14 October 2025 |
57.76 (0.02%) |
57.27 |
57.27 - 57.88 |
0.3452 times |
Mon 13 October 2025 |
57.75 (1.96%) |
57.34 |
57.34 - 57.78 |
0.1794 times |
Fri 10 October 2025 |
56.64 (-2.16%) |
57.83 |
56.57 - 57.95 |
0.3673 times |
Weekly price and charts NetherlandsInvstbl Strong weekly Stock price targets for NetherlandsInvstbl EWN are 58.42 and 59.61 | Weekly Target 1 | 57.46 | | Weekly Target 2 | 58.19 | | Weekly Target 3 | 58.653333333333 | | Weekly Target 4 | 59.38 | | Weekly Target 5 | 59.84 |
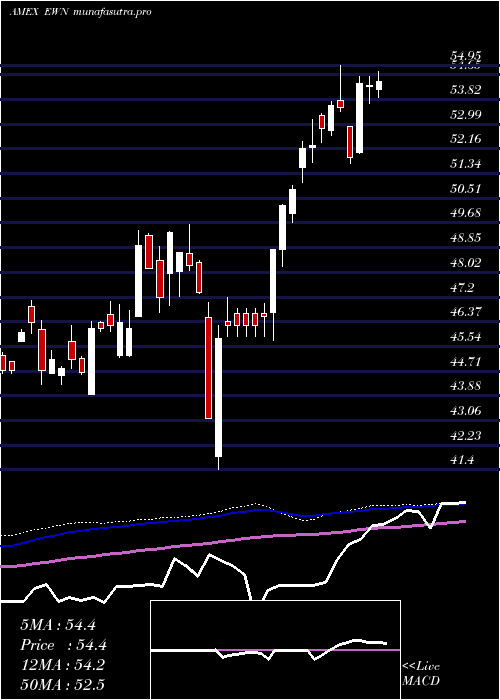
Weekly price and volumes for Netherlands Invstbl
| Date |
Closing |
Open |
Range |
Volume |
Fri 24 October 2025 |
58.91 (0.44%) |
58.61 |
57.93 - 59.12 |
0.7724 times |
Fri 17 October 2025 |
58.65 (3.55%) |
57.34 |
57.27 - 58.79 |
2.3794 times |
Fri 10 October 2025 |
56.64 (-5%) |
59.50 |
56.57 - 59.92 |
0.3123 times |
Fri 03 October 2025 |
59.62 (4.38%) |
57.53 |
57.53 - 59.72 |
0.7267 times |
Fri 26 September 2025 |
57.12 (0.49%) |
57.20 |
56.73 - 57.98 |
0.2339 times |
Fri 19 September 2025 |
56.84 (3.99%) |
55.12 |
55.12 - 57.22 |
4.557 times |
Fri 12 September 2025 |
54.66 (2.23%) |
53.94 |
53.66 - 54.66 |
0.3644 times |
Fri 05 September 2025 |
53.47 (0.89%) |
51.62 |
51.62 - 53.67 |
0.3953 times |
Fri 29 August 2025 |
53.00 (0%) |
53.04 |
52.99 - 53.09 |
0.0186 times |
Fri 29 August 2025 |
53.00 (-2.2%) |
54.18 |
52.99 - 54.22 |
0.2401 times |
Fri 22 August 2025 |
54.19 (1.94%) |
52.98 |
52.91 - 54.33 |
0.5034 times |
Monthly price and charts NetherlandsInvstbl Strong monthly Stock price targets for NetherlandsInvstbl EWN are 57.74 and 61.09 | Monthly Target 1 | 55.12 | | Monthly Target 2 | 57.01 | | Monthly Target 3 | 58.466666666667 | | Monthly Target 4 | 60.36 | | Monthly Target 5 | 61.82 |
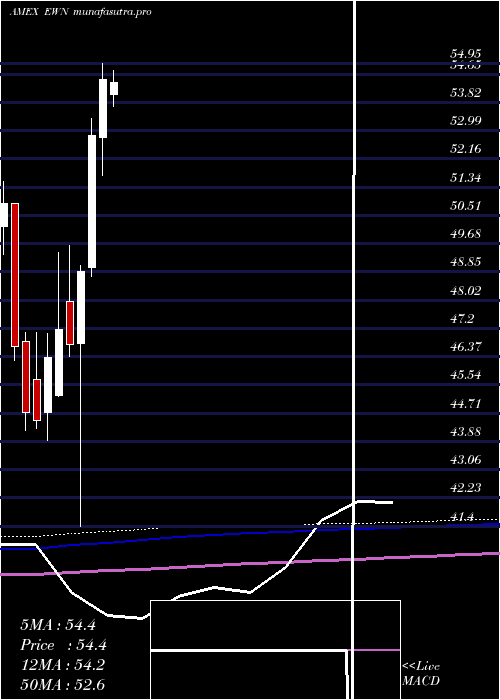
Monthly price and volumes Netherlands Invstbl
| Date |
Closing |
Open |
Range |
Volume |
Fri 24 October 2025 |
58.91 (1.55%) |
58.17 |
56.57 - 59.92 |
1.0269 times |
Tue 30 September 2025 |
58.01 (9.45%) |
51.62 |
51.62 - 58.09 |
1.3982 times |
Fri 29 August 2025 |
53.00 (3.39%) |
50.89 |
50.56 - 54.33 |
0.4754 times |
Thu 31 July 2025 |
51.26 (-5.94%) |
54.06 |
51.19 - 55.00 |
0.5816 times |
Mon 30 June 2025 |
54.50 (3.12%) |
52.78 |
51.69 - 54.95 |
0.7058 times |
Fri 30 May 2025 |
52.85 (8.19%) |
48.99 |
48.71 - 53.34 |
0.9118 times |
Wed 30 April 2025 |
48.85 (4.54%) |
46.77 |
41.40 - 49.05 |
0.6503 times |
Mon 31 March 2025 |
46.73 (-0.93%) |
47.98 |
46.36 - 49.64 |
0.8564 times |
Fri 28 February 2025 |
47.17 (1.77%) |
45.23 |
45.21 - 49.43 |
1.8356 times |
Fri 31 January 2025 |
46.35 (4.18%) |
44.73 |
43.92 - 47.06 |
1.5582 times |
Tue 31 December 2024 |
44.49 (-0.56%) |
45.70 |
44.26 - 47.09 |
1.468 times |
DMA SMA EMA moving averages of Netherlands Invstbl EWN
DMA (daily moving average) of Netherlands Invstbl EWN
| DMA period | DMA value | | 5 day DMA | 58.58 | | 12 day DMA | 58.2 | | 20 day DMA | 58.43 | | 35 day DMA | 57.35 | | 50 day DMA | 56.12 | | 100 day DMA | 54.75 | | 150 day DMA | 52.77 | | 200 day DMA | 51.4 | EMA (exponential moving average) of Netherlands Invstbl EWN
| EMA period | EMA current | EMA prev | EMA prev2 | | 5 day EMA | 58.62 | 58.47 | 58.3 | | 12 day EMA | 58.39 | 58.3 | 58.21 | | 20 day EMA | 58.07 | 57.98 | 57.89 | | 35 day EMA | 57.13 | 57.03 | 56.93 | | 50 day EMA | 56.1 | 55.99 | 55.88 |
SMA (simple moving average) of Netherlands Invstbl EWN
| SMA period | SMA current | SMA prev | SMA prev2 | | 5 day SMA | 58.58 | 58.53 | 58.47 | | 12 day SMA | 58.2 | 58.16 | 58.14 | | 20 day SMA | 58.43 | 58.34 | 58.25 | | 35 day SMA | 57.35 | 57.2 | 57.03 | | 50 day SMA | 56.12 | 56 | 55.89 | | 100 day SMA | 54.75 | 54.7 | 54.64 | | 150 day SMA | 52.77 | 52.7 | 52.63 | | 200 day SMA | 51.4 | 51.33 | 51.26 |
|
|
