MalaysiaIndex EWM full analysis,charts,indicators,moving averages,SMA,DMA,EMA,ADX,MACD,RSIMalaysia Index EWM WideScreen charts, DMA,SMA,EMA technical analysis, forecast prediction, by indicators ADX,MACD,RSI,CCI AMEX stock exchange
Daily price and charts and targets MalaysiaIndex Strong Daily Stock price targets for MalaysiaIndex EWM are 25.6 and 25.74 | Daily Target 1 | 25.49 | | Daily Target 2 | 25.57 | | Daily Target 3 | 25.626666666667 | | Daily Target 4 | 25.71 | | Daily Target 5 | 25.77 |
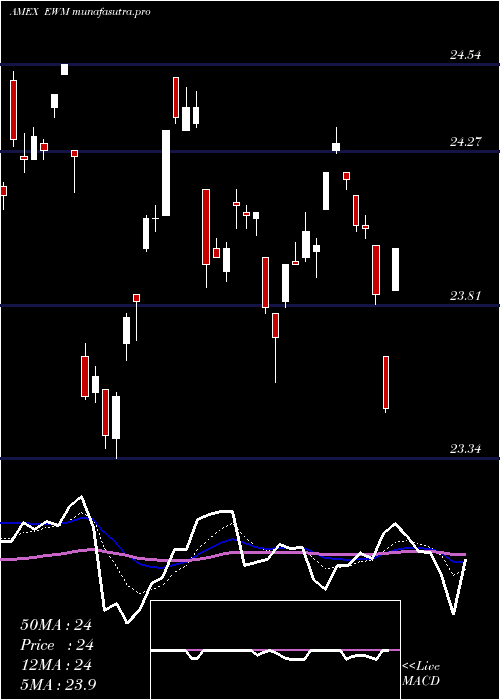
Daily price and volume Malaysia Index
| Date |
Closing |
Open |
Range |
Volume |
Thu 23 October 2025 |
25.66 (0.71%) |
25.56 |
25.54 - 25.68 |
0.4367 times |
Wed 22 October 2025 |
25.48 (-1.01%) |
25.74 |
25.40 - 25.74 |
1.4893 times |
Tue 21 October 2025 |
25.74 (-0.27%) |
25.71 |
25.63 - 25.76 |
0.5637 times |
Mon 20 October 2025 |
25.81 (0.43%) |
25.85 |
25.75 - 25.87 |
0.3772 times |
Fri 17 October 2025 |
25.70 (0.47%) |
25.71 |
25.54 - 25.72 |
0.6696 times |
Thu 16 October 2025 |
25.58 (-0.31%) |
25.66 |
25.54 - 25.69 |
0.7481 times |
Wed 15 October 2025 |
25.66 (-0.23%) |
25.61 |
25.61 - 25.72 |
2.0828 times |
Tue 14 October 2025 |
25.72 (0.04%) |
25.58 |
25.57 - 25.76 |
1.6217 times |
Mon 13 October 2025 |
25.71 (1.5%) |
25.69 |
25.63 - 25.74 |
1.0131 times |
Fri 10 October 2025 |
25.33 (-2.5%) |
25.79 |
25.32 - 25.84 |
0.9979 times |
Thu 09 October 2025 |
25.98 (-0.15%) |
26.10 |
25.91 - 26.10 |
0.5241 times |
Weekly price and charts MalaysiaIndex Strong weekly Stock price targets for MalaysiaIndex EWM are 25.3 and 25.77 | Weekly Target 1 | 25.17 | | Weekly Target 2 | 25.42 | | Weekly Target 3 | 25.643333333333 | | Weekly Target 4 | 25.89 | | Weekly Target 5 | 26.11 |
Weekly price and volumes for Malaysia Index
| Date |
Closing |
Open |
Range |
Volume |
Thu 23 October 2025 |
25.66 (-0.16%) |
25.85 |
25.40 - 25.87 |
0.5544 times |
Fri 17 October 2025 |
25.70 (1.46%) |
25.69 |
25.54 - 25.76 |
1.1865 times |
Fri 10 October 2025 |
25.33 (-3.32%) |
26.20 |
25.32 - 26.20 |
0.698 times |
Fri 03 October 2025 |
26.20 (1.83%) |
25.71 |
25.71 - 26.34 |
1.2549 times |
Fri 26 September 2025 |
25.73 (0.55%) |
25.66 |
25.23 - 25.81 |
1.184 times |
Fri 19 September 2025 |
25.59 (0.47%) |
25.55 |
25.47 - 26.05 |
1.2095 times |
Fri 12 September 2025 |
25.47 (1.76%) |
25.03 |
25.03 - 25.53 |
0.9893 times |
Fri 05 September 2025 |
25.03 (0.64%) |
24.80 |
24.65 - 25.13 |
0.9186 times |
Fri 29 August 2025 |
24.87 (0%) |
24.99 |
24.77 - 24.99 |
0.2612 times |
Fri 29 August 2025 |
24.87 (-3.3%) |
25.56 |
24.77 - 25.58 |
1.7436 times |
Fri 22 August 2025 |
25.72 (2.96%) |
25.01 |
25.01 - 25.72 |
0.9736 times |

Monthly price and charts MalaysiaIndex Strong monthly Stock price targets for MalaysiaIndex EWM are 24.98 and 26 | Monthly Target 1 | 24.75 | | Monthly Target 2 | 25.21 | | Monthly Target 3 | 25.773333333333 | | Monthly Target 4 | 26.23 | | Monthly Target 5 | 26.79 |
Monthly price and volumes Malaysia Index
| Date |
Closing |
Open |
Range |
Volume |
Thu 23 October 2025 |
25.66 (-1%) |
26.05 |
25.32 - 26.34 |
0.6483 times |
Tue 30 September 2025 |
25.92 (4.22%) |
24.80 |
24.65 - 26.05 |
0.8862 times |
Fri 29 August 2025 |
24.87 (5.87%) |
23.85 |
23.85 - 25.72 |
0.8473 times |
Thu 31 July 2025 |
23.49 (-3.49%) |
24.50 |
23.48 - 24.50 |
0.7356 times |
Mon 30 June 2025 |
24.34 (1.59%) |
24.05 |
23.34 - 24.54 |
0.6724 times |
Fri 30 May 2025 |
23.96 (-0.87%) |
24.21 |
23.87 - 25.09 |
0.8318 times |
Wed 30 April 2025 |
24.17 (4.72%) |
22.94 |
20.80 - 24.17 |
1.6193 times |
Mon 31 March 2025 |
23.08 (-2.49%) |
23.58 |
22.48 - 23.75 |
1.2027 times |
Fri 28 February 2025 |
23.67 (1.07%) |
23.23 |
23.20 - 24.44 |
1.0517 times |
Fri 31 January 2025 |
23.42 (-4.53%) |
24.45 |
23.11 - 24.50 |
1.5048 times |
Tue 31 December 2024 |
24.53 (0.25%) |
24.48 |
23.55 - 25.03 |
0.8236 times |

DMA SMA EMA moving averages of Malaysia Index EWM
DMA (daily moving average) of Malaysia Index EWM
| DMA period | DMA value | | 5 day DMA | 25.68 | | 12 day DMA | 25.7 | | 20 day DMA | 25.83 | | 35 day DMA | 25.66 | | 50 day DMA | 25.49 | | 100 day DMA | 24.82 | | 150 day DMA | 24.39 | | 200 day DMA | 24.22 | EMA (exponential moving average) of Malaysia Index EWM
| EMA period | EMA current | EMA prev | EMA prev2 | | 5 day EMA | 25.65 | 25.65 | 25.73 | | 12 day EMA | 25.7 | 25.71 | 25.75 | | 20 day EMA | 25.71 | 25.72 | 25.74 | | 35 day EMA | 25.6 | 25.6 | 25.61 | | 50 day EMA | 25.46 | 25.45 | 25.45 |
SMA (simple moving average) of Malaysia Index EWM
| SMA period | SMA current | SMA prev | SMA prev2 | | 5 day SMA | 25.68 | 25.66 | 25.7 | | 12 day SMA | 25.7 | 25.73 | 25.78 | | 20 day SMA | 25.83 | 25.81 | 25.8 | | 35 day SMA | 25.66 | 25.64 | 25.63 | | 50 day SMA | 25.49 | 25.48 | 25.48 | | 100 day SMA | 24.82 | 24.8 | 24.79 | | 150 day SMA | 24.39 | 24.37 | 24.36 | | 200 day SMA | 24.22 | 24.21 | 24.2 |
|
|
