SwitzerlandIndex EWL full analysis,charts,indicators,moving averages,SMA,DMA,EMA,ADX,MACD,RSISwitzerland Index EWL WideScreen charts, DMA,SMA,EMA technical analysis, forecast prediction, by indicators ADX,MACD,RSI,CCI AMEX stock exchange
Daily price and charts and targets SwitzerlandIndex Strong Daily Stock price targets for SwitzerlandIndex EWL are 57.04 and 57.28 | Daily Target 1 | 56.85 | | Daily Target 2 | 56.99 | | Daily Target 3 | 57.086666666667 | | Daily Target 4 | 57.23 | | Daily Target 5 | 57.33 |
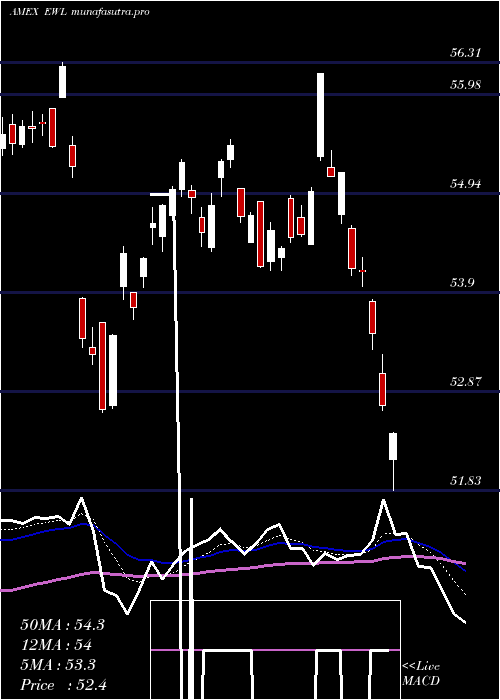
Daily price and volume Switzerland Index
| Date |
Closing |
Open |
Range |
Volume |
Thu 23 October 2025 |
57.14 (-0.05%) |
57.00 |
56.94 - 57.18 |
0.2385 times |
Wed 22 October 2025 |
57.17 (0.11%) |
57.05 |
57.03 - 57.32 |
0.6627 times |
Tue 21 October 2025 |
57.11 (-0.94%) |
57.26 |
57.10 - 57.36 |
0.8842 times |
Mon 20 October 2025 |
57.65 (-0.22%) |
57.67 |
57.34 - 57.67 |
0.7123 times |
Fri 17 October 2025 |
57.78 (0.54%) |
57.56 |
57.32 - 58.00 |
1.1426 times |
Thu 16 October 2025 |
57.47 (1.47%) |
57.21 |
57.15 - 57.63 |
1.199 times |
Wed 15 October 2025 |
56.64 (0.55%) |
56.20 |
56.20 - 56.73 |
1.3625 times |
Tue 14 October 2025 |
56.33 (0.45%) |
55.90 |
55.90 - 56.49 |
2.1993 times |
Mon 13 October 2025 |
56.08 (-0.04%) |
55.94 |
55.78 - 56.20 |
0.4454 times |
Fri 10 October 2025 |
56.10 (-0.46%) |
56.60 |
56.07 - 56.66 |
1.1537 times |
Thu 09 October 2025 |
56.36 (-0.83%) |
56.92 |
56.28 - 56.92 |
0.78 times |
Weekly price and charts SwitzerlandIndex Strong weekly Stock price targets for SwitzerlandIndex EWL are 56.68 and 57.41 | Weekly Target 1 | 56.52 | | Weekly Target 2 | 56.83 | | Weekly Target 3 | 57.25 | | Weekly Target 4 | 57.56 | | Weekly Target 5 | 57.98 |
Weekly price and volumes for Switzerland Index
| Date |
Closing |
Open |
Range |
Volume |
Thu 23 October 2025 |
57.14 (-1.11%) |
57.67 |
56.94 - 57.67 |
0.543 times |
Fri 17 October 2025 |
57.78 (2.99%) |
55.94 |
55.78 - 58.00 |
1.3803 times |
Fri 10 October 2025 |
56.10 (-0.99%) |
56.77 |
56.07 - 57.07 |
0.8972 times |
Fri 03 October 2025 |
56.66 (4.42%) |
54.35 |
54.29 - 56.76 |
1.7235 times |
Fri 26 September 2025 |
54.26 (-1.81%) |
55.44 |
53.70 - 55.62 |
1.4102 times |
Fri 19 September 2025 |
55.26 (-0.7%) |
55.60 |
55.02 - 55.76 |
0.8871 times |
Fri 12 September 2025 |
55.65 (-1.07%) |
56.21 |
55.53 - 56.35 |
1.2345 times |
Fri 05 September 2025 |
56.25 (1.66%) |
54.48 |
54.45 - 56.45 |
0.9888 times |
Fri 29 August 2025 |
55.33 (0%) |
55.32 |
55.24 - 55.47 |
0.166 times |
Fri 29 August 2025 |
55.33 (-0.56%) |
55.55 |
54.92 - 55.60 |
0.7694 times |
Fri 22 August 2025 |
55.64 (2.09%) |
54.16 |
54.15 - 55.76 |
1.003 times |

Monthly price and charts SwitzerlandIndex Strong monthly Stock price targets for SwitzerlandIndex EWL are 56.38 and 58.77 | Monthly Target 1 | 54.53 | | Monthly Target 2 | 55.83 | | Monthly Target 3 | 56.916666666667 | | Monthly Target 4 | 58.22 | | Monthly Target 5 | 59.31 |
Monthly price and volumes Switzerland Index
| Date |
Closing |
Open |
Range |
Volume |
Thu 23 October 2025 |
57.14 (3.44%) |
55.61 |
55.61 - 58.00 |
0.6148 times |
Tue 30 September 2025 |
55.24 (-0.16%) |
54.48 |
53.70 - 56.45 |
0.8838 times |
Fri 29 August 2025 |
55.33 (4.95%) |
52.16 |
51.83 - 55.76 |
1.0403 times |
Thu 31 July 2025 |
52.72 (-3.81%) |
54.71 |
52.67 - 56.20 |
1.0365 times |
Mon 30 June 2025 |
54.81 (-0.67%) |
55.20 |
52.65 - 56.31 |
0.8736 times |
Fri 30 May 2025 |
55.18 (2.45%) |
53.87 |
52.83 - 55.50 |
1.197 times |
Wed 30 April 2025 |
53.86 (4%) |
52.13 |
46.22 - 54.16 |
1.4132 times |
Mon 31 March 2025 |
51.79 (0.12%) |
52.35 |
51.43 - 53.61 |
1.1468 times |
Fri 28 February 2025 |
51.73 (4.36%) |
48.94 |
48.88 - 52.31 |
0.7216 times |
Fri 31 January 2025 |
49.57 (7.85%) |
46.22 |
45.80 - 50.21 |
1.0723 times |
Tue 31 December 2024 |
45.96 (-2.71%) |
48.02 |
45.56 - 48.35 |
0.8882 times |

DMA SMA EMA moving averages of Switzerland Index EWL
DMA (daily moving average) of Switzerland Index EWL
| DMA period | DMA value | | 5 day DMA | 57.37 | | 12 day DMA | 56.89 | | 20 day DMA | 56.44 | | 35 day DMA | 56.02 | | 50 day DMA | 55.75 | | 100 day DMA | 55.12 | | 150 day DMA | 54.31 | | 200 day DMA | 53.33 | EMA (exponential moving average) of Switzerland Index EWL
| EMA period | EMA current | EMA prev | EMA prev2 | | 5 day EMA | 57.18 | 57.2 | 57.22 | | 12 day EMA | 56.91 | 56.87 | 56.81 | | 20 day EMA | 56.58 | 56.52 | 56.45 | | 35 day EMA | 56.14 | 56.08 | 56.02 | | 50 day EMA | 55.75 | 55.69 | 55.63 |
SMA (simple moving average) of Switzerland Index EWL
| SMA period | SMA current | SMA prev | SMA prev2 | | 5 day SMA | 57.37 | 57.44 | 57.33 | | 12 day SMA | 56.89 | 56.84 | 56.8 | | 20 day SMA | 56.44 | 56.28 | 56.15 | | 35 day SMA | 56.02 | 55.98 | 55.92 | | 50 day SMA | 55.75 | 55.69 | 55.63 | | 100 day SMA | 55.12 | 55.1 | 55.07 | | 150 day SMA | 54.31 | 54.28 | 54.25 | | 200 day SMA | 53.33 | 53.28 | 53.23 |
|
|
